Q61Written answer
Sum of all the central angles in a pie chart is 360°.
Show solutionHide solution
Worked solution
Solution:-
True.
Your cart is empty.
Practice each question, then open the answer or worked solution.
Sum of all the central angles in a pie chart is 360°.
Solution:-
True.
In a pie chart two central angles can be of 180o.
Solution:-
True.
We know that sum of all the central angles in a pie chart is 360o. So, if two angles have 180o each then the sum of two angles is 360o.
In a pie chart two or more central angles can be equal.
Solution:-
True.
Yes, in a pie chart two or more central angles can be equal.
Getting a prime number on throwing a die is an event.
Solution:-
True.
Each outcome or a collection of outcomes in an experiment makes an Event.
9 students got full marks.
Using the following frequency table, answer questions 65-68
| Marks (obtained out of 10) | 4 | 5 | 7 | 8 | 9 | 10 |
| Frequency | 5 | 10 | 8 | 6 | 12 | 9 |
Solution:-
True.
From the table, given that 9 students got 10 out of 10 marks.
The frequency of less than 8 marks is 29.
Using the following frequency table, answer questions 65-68
| Marks (obtained out of 10) | 4 | 5 | 7 | 8 | 9 | 10 |
| Frequency | 5 | 10 | 8 | 6 | 12 | 9 |
Solution:-
False.
The frequency of less than 8 marks is 8 + 10 + 5 = 23 students.
The frequency of more than 8 marks is 21.
Using the following frequency table, answer questions 65-68
| Marks (obtained out of 10) | 4 | 5 | 7 | 8 | 9 | 10 |
| Frequency | 5 | 10 | 8 | 6 | 12 | 9 |
Solution:-
True.
The frequency of more than 8 marks is 12 + 9 = 21 students.
10 marks the highest frequency.
Using the following frequency table, answer questions 65-68
| Marks (obtained out of 10) | 4 | 5 | 7 | 8 | 9 | 10 |
| Frequency | 5 | 10 | 8 | 6 | 12 | 9 |
Solution:-
False.
9 marks has highest frequency, i.e. 12. But, 10 has 9 frequency.
If the fifth class interval is 60 – 65, fourth class interval is 55 – 60, then the first class interval is 45 –50.
Solution:-
False.
The first class interval is 40 – 45, second class interval is 45 – 50, third class interval is
50 – 55, fourth class interval 55 – 60, fifth class interval is 60 – 65.
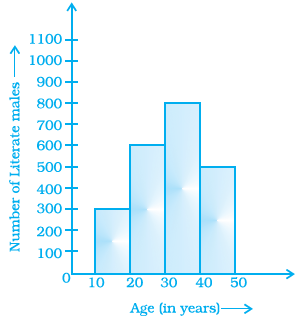 From the histogram given on the right, we
can say that 1500 males above the age of 20 are
literate.
Solution:-
False.
From the histogram given on the right, we
can say that 1900 (600 + 800 + 500) males above the age of 20 are
literate.