My Cart
Your Cart 0

    Your cart is empty.

  • Total (Amount) ₹0.00
NCERT Exemplar · Class 8 · Maths

Chapter 2: Data Handling

Practice each question, then open the answer or worked solution.

Some questions are missing from the current source. Exercise · Page 42: questions 88 missing from source

Exercise · Page 42

Textbook page 42 · 115 questions
Q11Written answer

Listed below are the temperature in oC for 10 days.

–6, –8, 0, 3, 2, 0, 1, 5, 4, 4

What is the range of the data?

Show solutionHide solution
Worked solution

Solution:-

(a) 8 (b) 13oC (c) 10oC (d) 12oC

Solution:-

(b) 13oC

The difference between the lowest and the highest observation in a given data is called its Range.

Then, Range = Highest observation – Lowest observation

= 5 – (-8)

= 5 + 8

= 13oC
Q12Written answer

Ram put some buttons on the table. There were 4 blue, 7 red, 3 black and 6 white buttons in all. All of a sudden, a cat jumped on the table and knocked out one button on the floor. What is the probability that the button on the floor is blue?

(a) 7/20 (b) 3/5 (c) 1/5 (d) ¼

Show solutionHide solution
Worked solution

Solution:-

(c) 1/5

Probability = Number of blue buttons on the table / Total number of buttons on the

table

= 4/20 … [divide both numerator and denominator by 4]

= 1/5

Q13Written answer

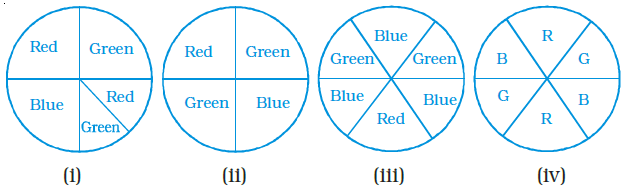
Rahul, Varun and Yash are playing a game of spinning a coloured wheel. Rahul wins if spinner lands on red. Varun wins if spinner lands on blue and Yash wins if it lands on green. Which of the following spinner should be used to make the game fair?

NCERT Exemplars Class 8 Maths Solutions Chapter 2 Image 2

(a) (i) (b) (ii) (c) iii (d) (iv)

Show solutionHide solution
Worked solution

Solution:-

(d) (iv) this figure contains equal share for three colours.

Q14Written answer

In a frequency distribution with classes 0 –10, 10 –20 etc., the size of the class intervals is 10. The lower limit of fourth class is

(a) 40 (b) 50 (c) 20 (d) 30

Show solutionHide solution
Worked solution

Solution:-

(d) 30

The lower value of the class interval is called its Lower Class Limit.

First class = 0 -10

Second class = 10 – 20

Third class = 20 – 30

Fourth class = 30 – 40

Fifth class = 40 – 50

and Tenth class = 90 – 100

Q15Written answer

A coin is tossed 200 times, and the head appeared 120 times. The probability of getting a head in this experiment is

(a) 2/5 (b) 3/5 (c) 1/5 (d) 4/5

Show solutionHide solution
Worked solution

Solution:-

(b) 3/5

Probability = Number of times head appeared / Total number of times coin is tossed

= 120/200

= 12/20 … [divide both numerator and denominator by 4]

= 3/5

Q16Written answer

Data collected in a survey shows that 40% of the buyers are interested in buying a particular brand of toothpaste. The central angle of the sector of the pie chart representing this information is

(a) 120o (b) 150o (c) 144o (d) 40°

Show solutionHide solution
Worked solution

Solution:-

(c) 144o

= (40/100) × 360o

= 0.4 × 360o

= 144o

Q17Written answer

Monthly salary of a person is Rs. 15000. The central angle of the sector representing his expenses on food and house rent on a pie chart is 60°. The amount he spends on food and house rent is

(a) Rs. 5000 (b) Rs. 2500 (c) Rs. 6000 (d) Rs. 9000

Show solutionHide solution
Worked solution

Solution:-

(b) Rs. 2500

From the question,

The part of monthly salary spent on food and house rent = 60o/360o

The amount he spends on food and house rent is = (60o/360o) × 15000

= Rs. 2500

Q18Written answer

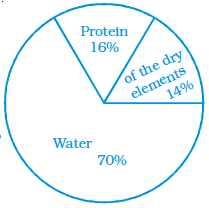
NCERT Exemplars Class 8 Maths Solutions Chapter 2 Image 3The following pie chart gives the distribution of constituents
in the human body. The central angle of the sector showing the

distribution of protein and other constituents is

(a) 108o (b) 54o (c) 30o (d) 216o

Show solutionHide solution
Worked solution

Solution:-

(a) 108o

The following pie chart gives the distribution of constituents

in the human body = 16% + 14% = 30%

= (30/100) × 360o

= 108o

Q19Written answer

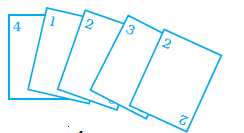
NCERT Exemplars Class 8 Maths Solutions Chapter 2 Image 4Rohan and Shalu are playing with 5 cards as shown
in the figure. What is the probability of Rohan picking

a card without seeing, that has the number 2 on it?

(a) 2/5 (b) 1/5 (c) 3/5 (d) 4/5

Show solutionHide solution
Worked solution

Solution:-

(a) 2/5

Probability = Number of cards having 2/ Total number of cards

= 2/5

Q20Written answer

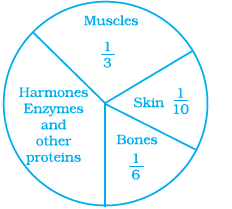
NCERT Exemplars Class 8 Maths Solutions Chapter 2 Image 5The following pie chart represents the distribution of

proteins in parts of the human body. What is the ratio of the distribution of proteins in the muscles to that of proteins

in the bones?

(a) 3 : 1 (b) 1 : 2 (c) 1 : 3 (d) 2 : 1

Show solutionHide solution
Worked solution

Solution:-

(d) 2 : 1

From the chart,

Distribution of protein in the muscles = 1/3

Distribution of protein in the bones = 1/6

Then,

Ratio of distribution of proteins in the muscles to that of proteins in the bones,

= 1/3 : 1/6

= (1/3) × (6/1)

= (1/1) × (2/1)

= 2/1

= 2 : 1