My Cart
Your Cart 0

    Your cart is empty.

  • Total (Amount) ₹0.00
NCERT Exemplar · Class 8 · Maths

Chapter 2: Data Handling

Practice each question, then open the answer or worked solution.

Some questions are missing from the current source. Exercise · Page 42: questions 88 missing from source

Exercise · Page 42

Textbook page 42 · 115 questions
Q102Written answer

Draw a histogram for the following data.

Class interval 10 – 15 15 – 20 20 – 25 25 – 30 30 – 35 35 – 40
Frequency 30 98 80 58 29 50
Show solutionHide solution
Worked solution

Solution:-

Scale:

On X – axis, 1 big division = 5 marks

On Y – axis, 1 big division = 10 students
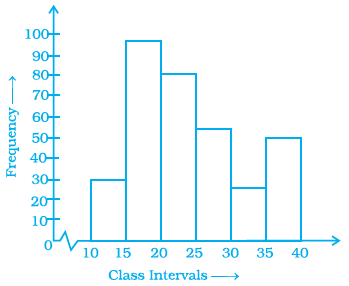
NCERT Exemplars Class 8 Maths Solutions Chapter 2 Image 29

Q103Written answer

In a hypothetical sample of 20 people, the amount of money (in thousands of rupees) with each was found to be as follows:

114, 108, 100, 98, 101, 109, 117, 119, 126, 131, 136, 143, 156, 169, 182, 195, 207, 219, 235, 118.

Draw a histogram of the frequency distribution, taking one of the class intervals as

50 –100.

Show solutionHide solution
Worked solution

Solution:-

From the data given in the question, first, we have to prepare a frequency distribution table,

NCERT Exemplars Class 8 Maths Solutions Chapter 2 Image 30Scale:

On X – axis, 1 big division = 50 ₹ marks

On Y – axis, 1 big division = 2 persons

NCERT Exemplars Class 8 Maths Solutions Chapter 2 Image 31

Q104Written answer

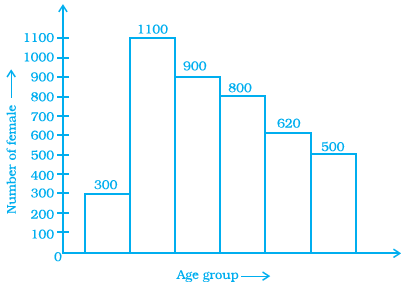
The below histogram shows the number of literate females in the age group of 10 to 40 years in a town.

(a) Write the classes assuming all the classes are of equal width.

(b) What is the class’s width?

(c) In which age group are literate females the least?

(d) In which age group is the number of literate females the highest?

NCERT Exemplars Class 8 Maths Solutions Chapter 2 Image 32

Show solutionHide solution
Worked solution

Solution:-

(a) The classes are, 10-15, 15-20, 20-25, 25-30, 30-35, and 35-40

b) The class width is 15 – 10 = 5

c) In the class first group i.e. 10-15 have the least female literate.

d) In the class second group i.e. 15-20 have the highest female literate.

Q105Written answer

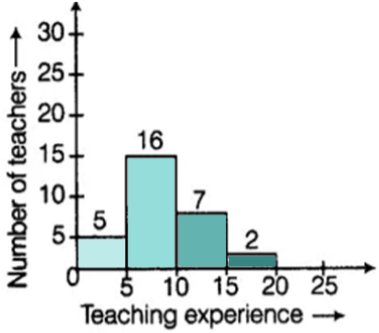
The following histogram shows the frequency distribution of teaching experiences of 30 teachers in various schools:

NCERT Exemplars Class 8 Maths Solutions Chapter 2 Image 33

(a) What is the class width?

Show solutionHide solution
Worked solution

Solution:-

The width of the class is 5.

(b) How many teachers have the maximum teaching experience, and how many have the least teaching experience?

Solution:-

Teachers having maximum teaching experience is 2, and Teachers having least teaching experience is 5.

(c) How many teachers have teaching experience of 10 to 20 years?

Solution:-

Teachers have teaching experience of 10 to 20 years is 7 + 2 = 9.

Q106Written answer

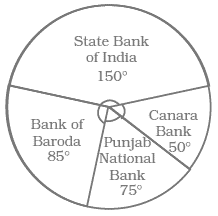
In a district, the number of branches of different banks is given below:

Bank State Bank of India Bank of Baroda Punjab National Bank Canara Bank
Number of Branches 30 17 15 10

Draw a pie chart for this data.

Show solutionHide solution
Worked solution

Solution:-

From the table,

Total number of branches of different banks in a district = 30 + 17 + 15 + 10

NCERT Exemplars Class 8 Maths Solutions Chapter 2 Image 34= 72

Central angle of pie chart for each bank,

State Bank of India = (30/72) × 360o

= 150o

Bank of Baroda = (17/72) × 360o

= 85o

Punjab National bank = (15/72) × 360o

= 75o

Canara Bank = (10/72) × 360o

= 50o

Q107Written answer

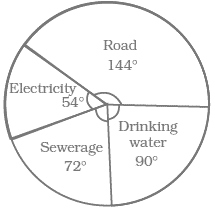
For the development of basic infrastructure in a district, a project of Rs 108 crore approved by the Development Bank is as follows:

Item Head Road Electricity Drinking water Sewerage
Amount in crore (Rs) 43.2 16.2 27.00 21.6

Draw a pie chart for this data.

Show solutionHide solution
Worked solution

Solution:-

From the question,

Total number approved = 108 crore

Central angle of pie chart for each infrastructure,

Road = (43.2/108) × 360o

= 144o

Electricity = (16.2/108) × 360o

NCERT Exemplars Class 8 Maths Solutions Chapter 2 Image 35= 54o

Drinking water = (27/108) × 360o

= 90o

Sewerage = (21.6/108) × 360o

= 72o

Q108Written answer

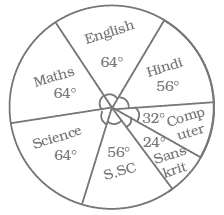
In the time table of a school, periods allotted per week to different teaching subjects are given below:

Subject Hindi English Maths Science Social Science Computer Sanskrit
Periods Allotted 7 8 8 8 7 4 3

Draw a pie chart for this data.

Show solutionHide solution
Worked solution

Solution:-

From the question,

Total number periods allotted = 7 + 8 + 8 + 8 + 7 + 4 + 3 = 45 periods

Central angle of pie chart for each subject,

Hindi = (7/45) × 360o

NCERT Exemplars Class 8 Maths Solutions Chapter 2 Image 36= 56o

English = (8/45) × 360o

= 64o

Maths = (8/45) × 360o

= 64o

Science = (8/45) × 360o

= 64o

Social Science = (7/45) × 360o

= 56o

Computer = (4/45) × 360o

= 32o

Sanskrit = (3/45) × 360o

= 24o

Q109Written answer

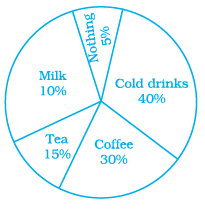
A survey was carried out to find the favourite beverage preferred by a certain group of young people. The following pie chart shows the findings of this survey. From this pie chart, answer the following:

NCERT Exemplars Class 8 Maths Solutions Chapter 2 Image 37

(i) Which type of beverage is liked by the maximum number of people?

Show solutionHide solution
Worked solution

Solution:-

Cold drink is liked by the maximum number of people.

(ii) If 45 people like tea, how many people were surveyed?

Solution:-

From the question, it is given that,

45 people like tea

Then,

Let us assume the total number of people surveyed be x,

= 45 = (15/100) × (x)

= 45 = 0.15x

= x = 45/0.15

= x = 300

So, the total number of people surveyed is 300.

Q110Written answer

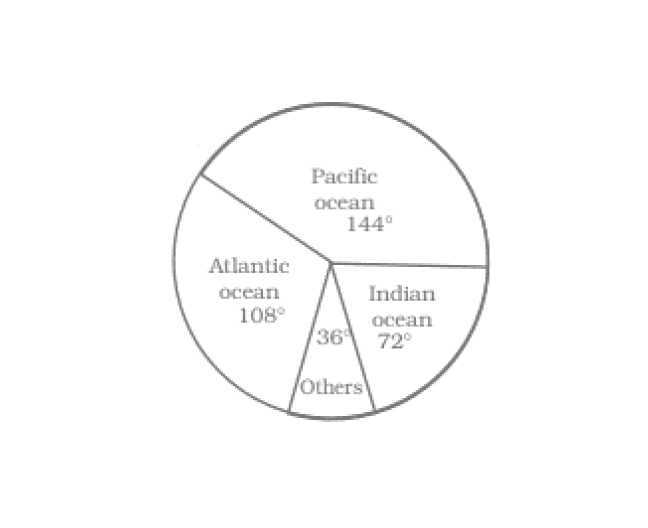
The following data represents the approximate percentage of water in various oceans. Prepare a pie chart for the given data.

Pacific 40%

Atlantic 30%

Indian 20%

Others 10%

Show solutionHide solution
Worked solution

Solution:-

The central angle of the given approximate percentage of water in various oceans,

Pacific = (40/100) × 360o

= 144o

NCERT Exemplars Class 8 Maths Solutions Chapter 2 Image 38
Atlantic = (30/100) × 360o

= 108o

Indian = (20/100) × 360o

= 72o

Others = (10/100) × 360o

= 36o

Q111Written answer

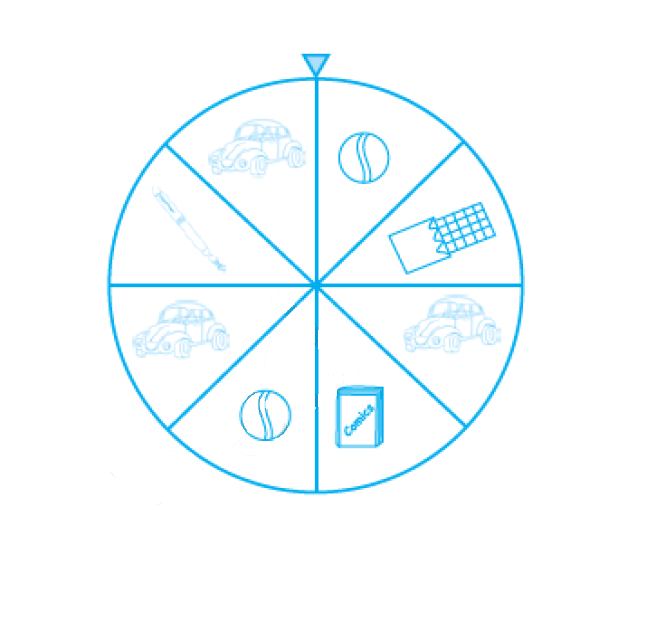
At a Birthday Party, the children spin a wheel to get a gift. Find the probability of

NCERT Exemplars Class 8 Maths Solutions Chapter 2 Image 39

(a) getting a ball

Show solutionHide solution
Worked solution

Solution:-

Number of balls in wheel = 2

Total number of gifts = 8

Probability of getting a ball = Number of balls in wheel/ total number of gifts

= 2/8 … [divide both by 2]

= 1/4

(b) getting a toy car

Solution:-

Number of cars in wheel = 3

Total number of gifts = 8

Probability of getting a ball = Number of balls in wheel/total number of gifts

= 3/8

(c) any toy except a chocolate

Solution:-

Number of toys except a chocolate = 7

Total number of gifts = 8

Probability of getting a ball = Number of balls in wheel/total number of gifts

= 7/8