My Cart
Your Cart 0

    Your cart is empty.

  • Total (Amount) ₹0.00
NCERT Exemplar · Class 8 · Maths

Chapter 2: Data Handling

Practice each question, then open the answer or worked solution.

Some questions are missing from the current source. Exercise · Page 42: questions 88 missing from source

Exercise · Page 42

Textbook page 42 · 115 questions
Q1Written answer

The height of a rectangle in a histogram shows the

(a) Width of the class (b) Upper limit of the class

(c) Lower limit of the class (d) Frequency of the class

Show solutionHide solution
Worked solution

Solution:-

(d) Frequency of the class
Q2Written answer

A geometric representation showing the relationship between a whole and its parts is a

(a) Pie chart (b) Histogram (c) Bar graph (d) Pictograph

Show solutionHide solution
Worked solution

Solution:-

(a) Pie chart

A geometric representation showing the relationship between a whole and its parts is a pie chart.

Q3Written answer

In a pie chart, the total angle at the centre of the circle is

(a) 180o (b) 360o (c) 270o (d) 90o

Show solutionHide solution
Worked solution

Solution:-

(b) 360o

Q4Written answer

The range of the data 30, 61, 55, 56, 60, 20, 26, 46, 28, 56 is

(a) 26 (b) 30 (c) 41 (d) 61

Show solutionHide solution
Worked solution

Solution:-

(c) 41

The difference between the lowest and the highest observation in a given data is called its Range.

Then, Range = Highest observation – Lowest observation

= 61 – 20

= 41

Q5Written answer

Which of the following is not a random experiment?

(a) Tossing a coin (b) Rolling a dice

(c) Choosing a card from a deck of 52 cards

(d) Throwing a stone from a roof of a building

Show solutionHide solution
Worked solution

Solution:-

(d) Throwing a stone from a roof of a building.

There is only one output, that is, the stone will fall down; therefore, it is not a random experiment.

Q6Written answer

What is the probability of choosing a vowel from the alphabet?

(a) 21/26 (b) 5/26 (c) 1/26 (d) 3/26

Show solutionHide solution
Worked solution

Solution:-

(b) 5/26

Probability = Number of Vowels/ Total number of alphabets

= 5/26

Q7Written answer

In a school only, 3 out of 5 students can participate in a competition. What is the probability of the students who do not make it to the competition?

(a) 0.65 (b) 0.4 (c) 0.45 (d) 0.6

Show solutionHide solution
Worked solution

Solution:-

(b) 0.4

Probability = Number of students who do not make it to the competition / Total number

of students.

= 2/5

= 0.4

Q8Written answer

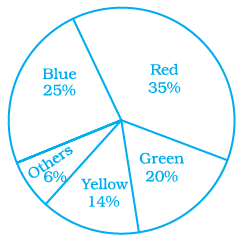
Which colour received 1/5 of the votes?

Students of a class voted for their favourite colour, and a pie chart was prepared based on the data collected.

Observe the pie chart given below and answer questions 8 –10 based on it.

NCERT Exemplars Class 8 Maths Solutions Chapter 2 Image 1

(a) Red (b) Blue (c) Green (d) Yellow

Show solutionHide solution
Worked solution

Solution:-

(c) Green

= 1/5 × 100

= 0.2 × 100

= 20%

Q9Written answer

If 400 students voted in all, then how many did vote ‘Others’ colour as their favourite?

Students of a class voted for their favourite colour, and a pie chart was prepared based on the data collected.

Observe the pie chart given below and answer questions 8 –10 based on it.

NCERT Exemplars Class 8 Maths Solutions Chapter 2 Image 1

(a) 6 (b) 20 (c) 24 (d) 40

Show solutionHide solution
Worked solution

Solution:-

(c) 24

From the pie chart, 6% out of 400 students voted for others,

So,

= (6%/100%) × 400

= 0.06 × 400

= 24

Q10Multiple choice

Which of the following is a reasonable conclusion for the given data?

Students of a class voted for their favourite colour, and a pie chart was prepared based on the data collected.

Observe the pie chart given below and answer questions 8 –10 based on it.

NCERT Exemplars Class 8 Maths Solutions Chapter 2 Image 1

Show solutionHide solution
Worked solution

Solution:-

(d) Number of students liking together yellow and green colour is approximately the same as those for red colour.