My Cart
Your Cart 0

    Your cart is empty.

  • Total (Amount) ₹0.00
NCERT Exemplar · Class 8 · Maths

Chapter 12: Introduction to Graphs

Practice each question, then open the answer or worked solution.

Questions

50 questions
Q1Written answer

Comparison of parts of a whole may be done by a

(a) Bar graph (b) pie chart (c) linear graph (d) line graph

Show solutionHide solution
Worked solution

Solution: The correct answer is option (b) Pie chart

Explanation:

A pie chart is used to compare the parts of a whole because the circle represents the whole.
Q2Written answer

A graph that displays data that changes continuously over periods of time is

(a) Bar graph (b) pie chart (c) histogram (d) line graph

Show solutionHide solution
Worked solution

Solution: The correct answer is option (d) Line graph

Explanation:

A line graph displays the continuous change of data over a period of time, like speed or distance covered.

Q3Written answer

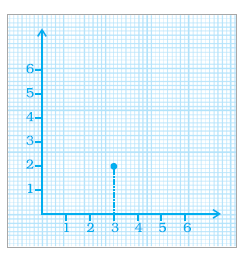
In the given graph, the coordinates of point x are

(a) (0, 2) (b) (2, 3) (c) (3, 2) (d) (3, 0)

NCERT Exemplar Class 8 Maths Solutions for Chapter 12 - 1

Show solutionHide solution
Worked solution

Solution: The correct answer is option (c) (3, 2)

Explanation:

To find the coordinate, draw the perpendicular line from point x to the x-axis and y from the y-axis. From the given figure, the coordinate of the x-axis is 3, and the coordinate of the y-axis is 2.

Hence, the coordinate of x is (3, 2)

Q4Written answer

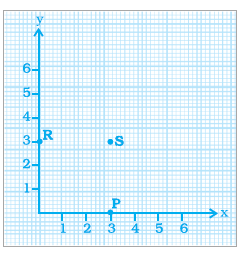
In the given graph, the letter that indicates the point (0, 3) is

(a) P (b) Q (c) R (d) S

NCERT Exemplar Class 8 Maths Solutions for Chapter 12 - 2

Show solutionHide solution
Worked solution

Solution: The correct answer is option (c) R

Explanation:

From the given figure, the coordinates of S is (3, 3), the coordinates of P is (3, 0), and the Coordinates of R is (0, 3)

Hence, option c is correct.

Q5Written answer

Point (3, 4) is at a distance of

(a) 3 from both the axis (b) 4 from both the axis

(c) 4 from the x axis and 3 from y axis (d) 3 from x axis and from y axis

Show solutionHide solution
Worked solution

Solution: The correct answer is option (c) 4 from the x-axis and 3 from y-axis

Explanation:

In the coordinate (3, 4), the first number represents the distance on the x-axis or y-coordinate, whereas the second number, 4, represents the distance on the y-axis or the x-coordinate.

Q6Written answer

A point which lies on both the axis is __________

(a) (0, 0) (b) (0, 1) (c) (1, 0) (d) (1, 1)

Show solutionHide solution
Worked solution

Solution: The correct answer is option (a)

Explanation:

Both the x-axis and y-axis are perpendicular to each other, and they meet at a single point called the origin (0, 0)

Q7Written answer

The coordinates of a point at a distance of 3 units from the x-axis and 6 units from the y-axis is

(a) (0, 3) (b) (6, 0) (c) (3, 6) (d) (6, 3)

Show solutionHide solution
Worked solution

Solution: The correct answer is option (d) (6, 3)

Explanation:

It is known that the distance from the x-axis gives the y-coordinate, and the distance from the y-axis gives the x-coordinate. Hence, the coordinate point is (6, 3).

Q8Written answer

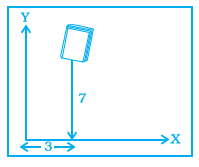
In the given figure, the position of the book on the table may be given by

(a) (7, 3) (b) (3, 7)

(c) (3, 3) (d) (7, 7)

NCERT Exemplar Class 8 Maths Solutions for Chapter 12 - 3

Show solutionHide solution
Worked solution

Solution: The correct answer is option (b) (3, 7)

Explanation:

The book is positioned at a distance of 3 units from the y-axis and 7 units from the x-axis. Hence, the required coordinate point is (3, 7).

Q9Written answer

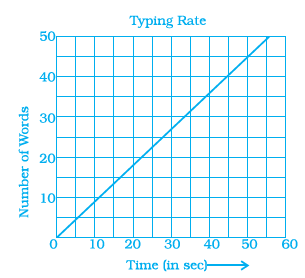
Data was collected on a student’s typing rate, and the graph was drawn as shown below. Approximately how many words had this student typed in 30 seconds?

(a) 20 (b) 24 (c) 28 (d) 34

NCERT Exemplar Class 8 Maths Solutions for Chapter 12 - 4

Show solutionHide solution
Worked solution

Solution: The correct answer is option (c) 28

Explanation:

From the given graph, the time (in sec) is taken in the x-axis and the number of words in the y-axis. When the look for the line graph to find the number of words corresponding to 30 seconds in the x-axis, the words typed in 30 seconds come out is approximately 28 words.

Q10Written answer

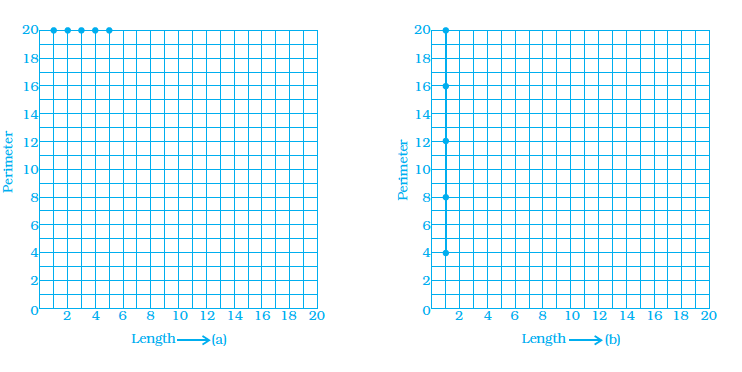
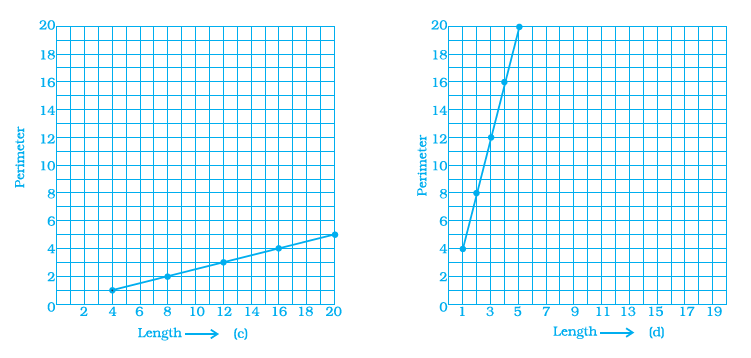
Which graphs of the following represent the table below?

Length of Side of a Square 1 2 3 4 5
Perimeter 4 8 12 16 20

NCERT Exemplar Class 8 Maths Solutions for Chapter 12 - 5NCERT Exemplar Class 8 Maths Solutions for Chapter 12 - 6

Show solutionHide solution
Worked solution

Solution: The correct answer is option (d)

Explanation:

It is given that the x-axis represents the length of the square side, and the y-axis represents the perimeter. When you plot the given points in the graph, the answer should be option (d).

In questions 11 to 25, fill in the blanks to make the statements true.