The height of a rectangle in a histogram shows the
(a) Width of the class (b) Upper limit of the class
(c) Lower limit of the class (d) Frequency of the class
Show solutionHide solution
Solution:-
(d) Frequency of the class
Your cart is empty.
Practice each question, then open the answer or worked solution.
The height of a rectangle in a histogram shows the
(a) Width of the class (b) Upper limit of the class
(c) Lower limit of the class (d) Frequency of the class
Solution:-
(d) Frequency of the class
A geometric representation showing the relationship between a whole and its parts is a
(a) Pie chart (b) Histogram (c) Bar graph (d) Pictograph
Solution:-
(a) Pie chart
A geometric representation showing the relationship between a whole and its parts is a pie chart.
In a pie chart, the total angle at the centre of the circle is
(a) 180o (b) 360o (c) 270o (d) 90o
Solution:-
(b) 360o
The range of the data 30, 61, 55, 56, 60, 20, 26, 46, 28, 56 is
(a) 26 (b) 30 (c) 41 (d) 61
Solution:-
(c) 41
The difference between the lowest and the highest observation in a given data is called its Range.
Then, Range = Highest observation – Lowest observation
= 61 – 20
= 41
Which of the following is not a random experiment?
(a) Tossing a coin (b) Rolling a dice
(c) Choosing a card from a deck of 52 cards
(d) Throwing a stone from a roof of a building
Solution:-
(d) Throwing a stone from a roof of a building.
There is only one output, that is, the stone will fall down; therefore, it is not a random experiment.
What is the probability of choosing a vowel from the alphabet?
(a) 21/26 (b) 5/26 (c) 1/26 (d) 3/26
Solution:-
(b) 5/26
Probability = Number of Vowels/ Total number of alphabets
= 5/26
In a school only, 3 out of 5 students can participate in a competition. What is the probability of the students who do not make it to the competition?
(a) 0.65 (b) 0.4 (c) 0.45 (d) 0.6
Solution:-
(b) 0.4
Probability = Number of students who do not make it to the competition / Total number
of students.
= 2/5
= 0.4
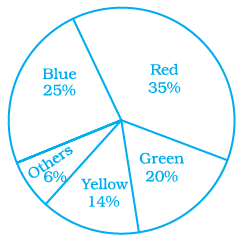
Which colour received 1/5 of the votes?
Students of a class voted for their favourite colour, and a pie chart was prepared based on the data collected.
Observe the pie chart given below and answer questions 8 –10 based on it.

(a) Red (b) Blue (c) Green (d) Yellow
Solution:-
(c) Green
= 1/5 × 100
= 0.2 × 100
= 20%
If 400 students voted in all, then how many did vote ‘Others’ colour as their favourite?
Students of a class voted for their favourite colour, and a pie chart was prepared based on the data collected.
Observe the pie chart given below and answer questions 8 –10 based on it.

(a) 6 (b) 20 (c) 24 (d) 40
Solution:-
(c) 24
From the pie chart, 6% out of 400 students voted for others,
So,
= (6%/100%) × 400
= 0.06 × 400
= 24
Which of the following is a reasonable conclusion for the given data?
Students of a class voted for their favourite colour, and a pie chart was prepared based on the data collected.
Observe the pie chart given below and answer questions 8 –10 based on it.

Solution:-
(d) Number of students liking together yellow and green colour is approximately the same as those for red colour.