My Cart
Your Cart 0

    Your cart is empty.

  • Total (Amount) ₹0.00
NCERT Exemplar · Class 8 · Maths

Chapter 2: Data Handling

Practice each question, then open the answer or worked solution.

Some questions are missing from the current source. Exercise · Page 42: questions 88 missing from source

Exercise · Page 42

Textbook page 42 · 115 questions
Q21Written answer

What is the central angle of the sector (in the above pie chart) representing skin and bones together?
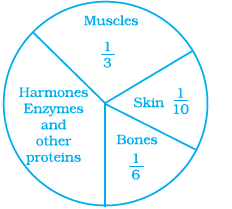
NCERT Exemplars Class 8 Maths Solutions Chapter 2 Image 5

(a) 36o (b) 60o (c) 90o (d) 96o

Show solutionHide solution
Worked solution

Solution:-

(d) 96o

Distribution of protein in the skin = 1/10

Distribution of protein in the bones = 1/6

Central angle of the sector representing skin and bones,

= 1/10 + 1/6

= (3 + 5)/30

= 8/30 × 360o

= 96o
Q22Written answer

What is the central angle of the sector (in the above pie chart) representing hormones enzymes and other proteins?

NCERT Exemplars Class 8 Maths Solutions Chapter 2 Image 5

(a) 120o (b) 144o (c) 156o (d) 176o

Show solutionHide solution
Worked solution

Solution:-

(b) 144o

Distribution of protein in the skin = 1/10

Distribution of protein in the bones = 1/6

Distribution of protein in the Muscles = 1/3

Central angle of the sector represents skin, muscles and bones,

= 1/10 + 1/6 + 1/3

= (3 + 5 + 10)/30

= 18/30 × 360o

= 216o

Then,

Central angle of the sector represents hormones enzymes and other proteins,

= 360o – 216o

= 144o

Q23Written answer

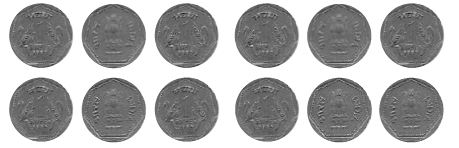
A coin is tossed 12 times and the outcomes are observed as shown below:

NCERT Exemplars Class 8 Maths Solutions Chapter 2 Image 6

The chance of occurrence of Head is

(a) ½ (b) 5/12 (c) 7/12 (d) 5/7

Show solutionHide solution
Worked solution

Solution:-

(b) 5/12 … [from the figure]

Q24Written answer

Total number of outcomes, when a ball is drawn from a bag which contains 3 red, 5 black and 4 blue balls is

(a) 8 (b) 7 (c) 9 (d) 12

Show solutionHide solution
Worked solution

Solution:-

(d) 12

Q25Written answer

A graph showing two sets of data simultaneously is known as

(a) Pictograph (b) Histogram (c) Pie chart (d) Double bar graph

Show solutionHide solution
Worked solution

Solution:-

(d) Double bar graph

Q26Written answer

Size of the class 150 –175 is

(a) 150 (b) 175 (c) 25 (d) –25

Show solutionHide solution
Worked solution

Solution:-

(c) 25

The difference between the upper-class limit and lower class limit of a class is called the Size of the class.

= Upper limit – lower limit

= 175 – 150

= 25

Q27Written answer

In a throw of a dice, the probability of getting the number 7 is

(a) ½ (b) 1/6 (c) 1 (d) 0

Show solutionHide solution
Worked solution

Solution:-

(d) 0

Only 1, 2, 3, 4, 5 and 6 are in the dice. So, no chance of getting number 7.

Q28Written answer

Data represented using circles is known as

(a)Bar graph (b) Histogram (c) Pictograph (d) Pie chart

Show solutionHide solution
Worked solution

Solution:-

(d) Pie chart.

Q29Written answer

Tally marks are used to find

(a) Class intervals (b) Range (c) Frequency (d) Upper limit

Show solutionHide solution
Worked solution

Solution:-

(c) Frequency

Q30Written answer

Upper limit of class interval 75 –85 is

(a) 10 (b) –10 (c) 75 (d) 85

Show solutionHide solution
Worked solution

Solution:-

(d) 85