My Cart
Your Cart 0

    Your cart is empty.

  • Total (Amount) ₹0.00
NCERT Exemplar · Class 9 · Maths

Chapter 14: Statistics and Probability

Practice each question, then open the answer or worked solution.

Exercise 14.4

Textbook page 147 · 5 questions
Q1Written answer

The following are the marks (out of 100) of 60 students in mathematics.

16, 13, 5, 80, 86, 7, 51, 48, 24, 56, 70, 19, 61, 17, 16, 36, 34, 42, 34, 35, 72, 55, 75,

31, 52, 28,72, 97, 74, 45, 62, 68, 86, 35, 85, 36, 81, 75, 55, 26, 95, 31, 7, 78, 92, 62,

52, 56, 15, 63,25, 36, 54, 44, 47, 27, 72, 17, 4, 30.

Construct a grouped frequency distribution table with width 10 of each class starting from 0 – 9.

Show solutionHide solution
Worked solution

Arranging the given data in ascending order

4, 5, 7, 7,13,15,16,16,17,17,19, 24, 25, 26, 27, 28, 30, 31,31,34, 34, 35, 35, 36, 36, 36, 42, 44, 45, 47, 48, 51, 52, 52, 54, 55, 55, 56, 56, 61,62, 62, 63, 68, 70, 72, 72, 72, 74, 75, 75, 78, 80, 81,85, 86, 86, 92, 95, 97.

Then arrange the given data into groups with 10 as class width in each case.

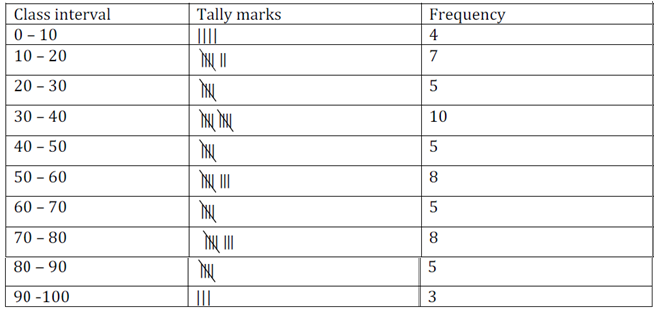
The Frequency Distribution Table of the given data can be represented as follows:
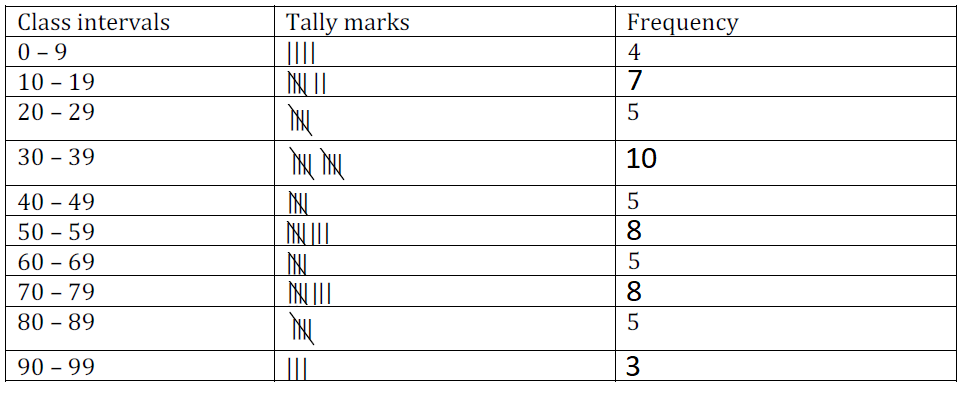
NCERT Exemplar Solutions Class 9 Maths Chapter 14 Ex.14.4-1

Q2Written answer

Refer to Q1 above. Construct a grouped frequency distribution table with width 10 of each class, in such a way that one of the classes is 10 – 20 (20 not included).

Show solutionHide solution
Worked solution

The grouped frequency distribution table with width 10 of each class, in such a way that one of the classes is 10 – 20 (20 not included) is represented below:

NCERT Exemplar Solutions Class 9 Maths Chapter 14 Ex.14.4-2

Q3Written answer

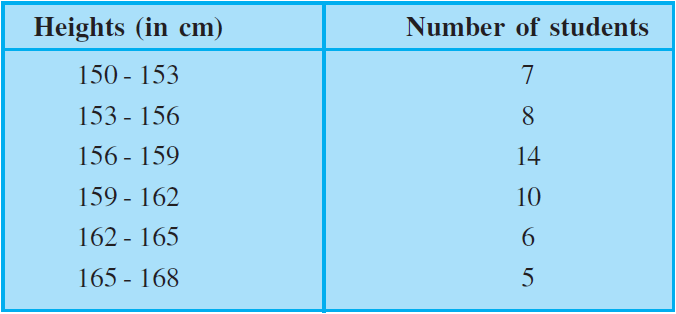
Draw a histogram of the following distribution:

NCERT Exemplar Solutions Class 9 Maths Chapter 14 Ex.14.4-3

Show solutionHide solution
Worked solution

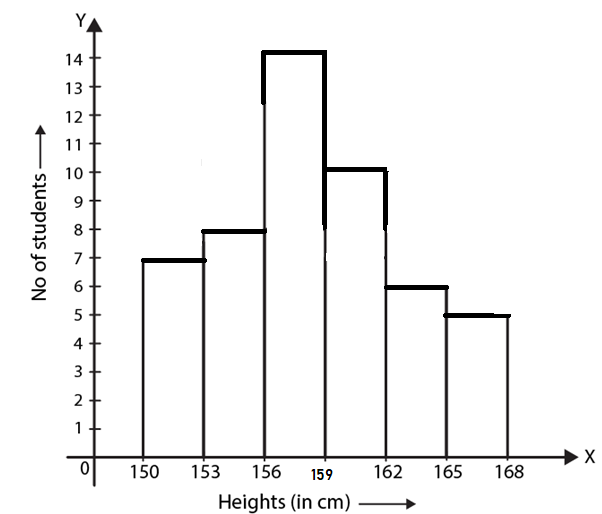
NCERT Exemplar Solutions Class 9 Maths Chapter 14 Ex.14.4-4

Q4Written answer

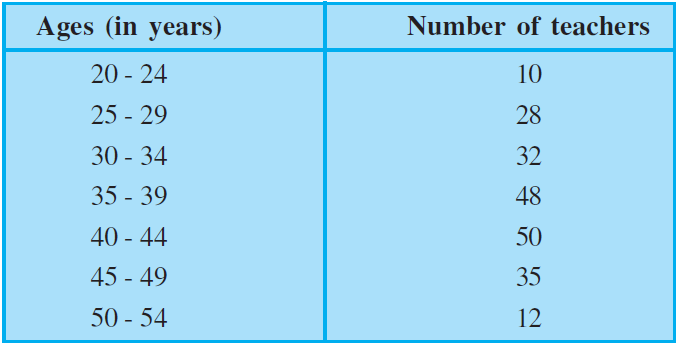
Draw a histogram to represent the following grouped frequency distribution:

NCERT Exemplar Solutions Class 9 Maths Chapter 14 Ex.14.4-5

Show solutionHide solution
Worked solution

The frequency distribution table is in inclusive form. First we must convert it to exclusive form.

Consider the class 20-24, 25-29.

Lower limit of 25-29 is 25

Upper limit of 20-24 is 24

Half of the difference = (25-24)/2 = 1/2 = 0.5

We should subtract 0.5 from each lower limit and add 0.5 to each upper limit.

Let us first make the data continuous:

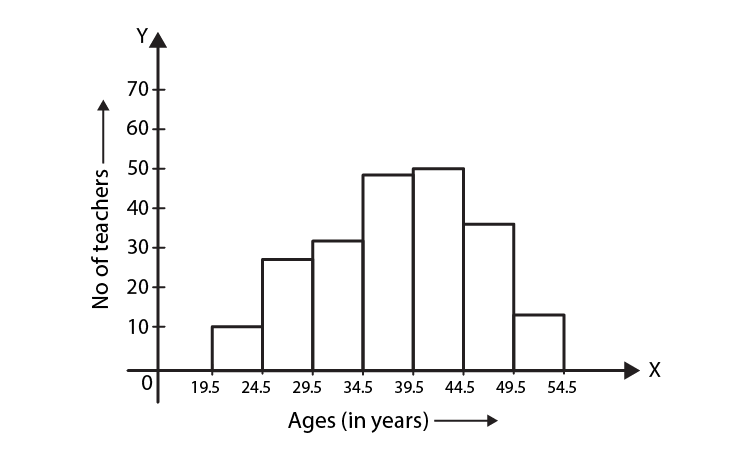
Ages Number of teachers
19.5 – 24.5 10
24.5 – 29.5 28
29.5 – 34.5 32
34.5 – 39.5 48
39.5 – 44.5 50
44.5 – 49.5 35
49.5 – 54.5 12

Hence, the histogram can be represented as:

NCERT Exemplar Solutions Class 9 Maths Chapter 14 Ex.14.4-6

Q5Written answer

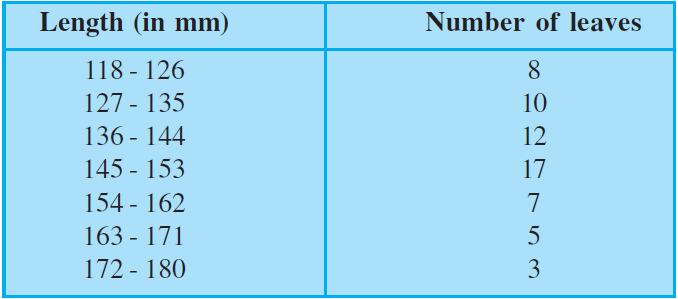
The lengths of 62 leaves of a plant are measured in millimetres and the data is represented in the following table:

NCERT Exemplar Solutions Class 9 Maths Chapter 14 Ex.14.4-7

Draw a histogram to represent the data above.

Show solutionHide solution
Worked solution

The frequency distribution table is in inclusive form. First we must convert it to exclusive form.

Half of the difference = (127-126)/2 = 1/2 = 0.5

We should subtract 0.5 from each lower limit and add 0.5 to each upper limit.

Let us first make the data continuous:

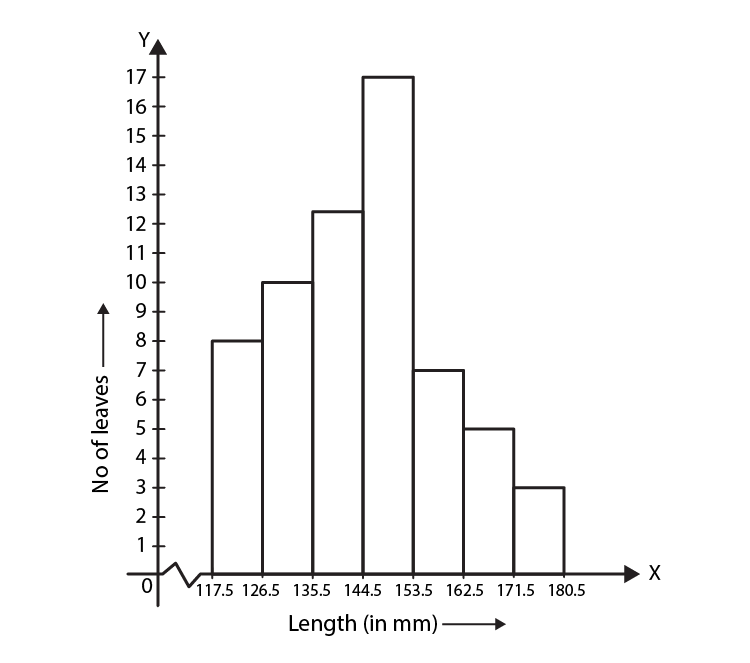
Length (in mm) Number of Leaves
117.5 – 126.5 8
126.5 – 135.5 10
135.5 – 144.5 12
144.5 – 153.5 17
153.5 – 162.5 7
162.5 – 171.5 5
171.5 – 180.5 3

Hence, the histogram can be represented as:

NCERT Exemplar Solutions Class 9 Maths Chapter 14 Ex.14.4-8