My Cart
Your Cart 0

    Your cart is empty.

  • Total (Amount) ₹0.00
NCERT Exemplar · Class 9 · Maths

Chapter 14: Statistics and Probability

Practice each question, then open the answer or worked solution.

Exercise 14.2

Textbook page 136 · 5 questions
Q1Written answer

The frequency distribution:

NCERT Exemplar Solutions Class 9 Maths Chapter 14 Ex.14.2-1

has been represented graphically as follows :
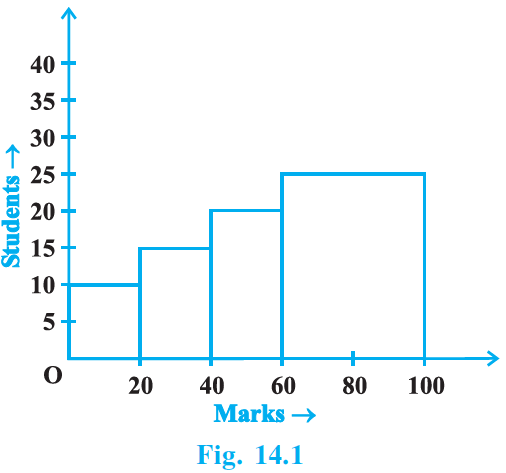
NCERT Exemplar Solutions Class 9 Maths Chapter 14 Ex.14.2-2

Do you think this representation is correct? Why?

Show solutionHide solution
Worked solution

No, the above representation is not correct.

Reason:

The classes 0 – 20, 20 – 40, 40 – 60 and 60 – 100 are not of uniform width but of varying widths.

Q2Written answer

In a diagnostic test in mathematics given to students, the following marks (out of 100) are recorded:

46, 52, 48, 11, 41, 62, 54, 53, 96, 40, 98, 44

Which ‘average’ will be a good representative of the above data and why?

Show solutionHide solution
Worked solution

Median will be a good representative of the data given in the question, because

a) each value occurs once.

b) the data is influenced by extreme values.

Q3Written answer

A child says that the median of 3, 14, 18, 20, 5 is 18. What doesn’t the child understand about finding the median?

Show solutionHide solution
Worked solution

Since the child says that the median of 3, 14, 18, 20, 5 is 18, it is clear that the child doesn’t understand the fact that the given data should be arranged in ascending or descending order before finding the middle term, i.e., median.

Once the child is familiar with the concept,

He/she will understand that,

Arranging the given data in ascending order, we get,

3, 5, 14, 18, 20

And hence,

The median = 14

Q4Written answer

A football player scored the following number of goals in the 10 matches:

1, 3, 2, 5, 8, 6, 1, 4, 7, 9

Since the number of matches is 10 (an even number), therefore, the median

= (5th observation + 6th observation)/2 = (8+6)/2 = 7

Is it the correct answer and why?

Show solutionHide solution
Worked solution

No.

The obtained data solution in the question not the correct answer, because the data has to be arranged in either ascending or descending order before finding the median.

Now,

Arranging the data in ascending order, we get,

1, 1, 2, 3, 4, 5, 6, 7, 8, 9.

Here, number of observations is 10, which is even.

So, median = ((n/2)th observation + ((n/2)+1)th observation)/2

= ((10/2)th observation + ((10/2)+1)th observation)/2

= ((5)th observation + (6)th observation)/2

= (4 + 5)/2

= 9/2

= 4.5

Q5Written answer

Is it correct to say that in a histogram, the area of each rectangle is proportional to the class size of the corresponding class interval? If not, correct the statement.

Show solutionHide solution
Worked solution

The statement “in a histogram, the area of each rectangle is proportional to the class size of the corresponding class interval” is not correct. Because in a histogram, the area of each rectangle is proportional to the corresponding frequency of its class.