My Cart
Your Cart 0

    Your cart is empty.

  • Total (Amount) ₹0.00
NCERT Exemplar · Class 9 · Maths

Chapter 14: Statistics and Probability

Practice each question, then open the answer or worked solution.

Exercise 14.3

Textbook page 140 · 10 questions
Q1Written answer

The blood groups of 30 students are recorded as follows:

A, B, O, A, AB, O, A, O, B, A, O, B, A, AB, B, A, AB, B,

A, A, O, A, AB, B, A, O, B, A, B, A

Prepare a frequency distribution table for the data.

Show solutionHide solution
Worked solution

The frequency distribution table for the data is as follows:


Blood group Frequency
A 12
AB 4
B 8
O 6
Total 30
Q2Written answer

The value of π upto 35 decimal places is given below:

3. 14159265358979323846264338327950288

Make a frequency distribution of the digits 0 to 9 after the decimal point.

Show solutionHide solution
Worked solution

The frequency distribution of the digits 0 to 9 after the decimal point is as follows:

Digits Frequency
0 1
1 2
2 5
3 6
4 3
5 4
6 3
7 2
8 5
9 4
Q3Written answer

The scores (out of 100) obtained by 33 students in a mathematics test are as follows:

69, 48, 84, 58, 48, 73, 83, 48, 66, 58, 84 000

66, 64, 71, 64, 66, 69, 66, 83, 66, 69, 71

81, 71, 73, 69, 66, 66, 64, 58, 64, 69, 69

Represent this data in the form of a frequency distribution.

Show solutionHide solution
Worked solution

The given data in the question in a frequency distribution table can be represented as:

Scores N/O students

Frequency

48 3
58 3
64 4
66 7
69 6
71 3
73 2
81 1
83 2
84 2
Q4Written answer

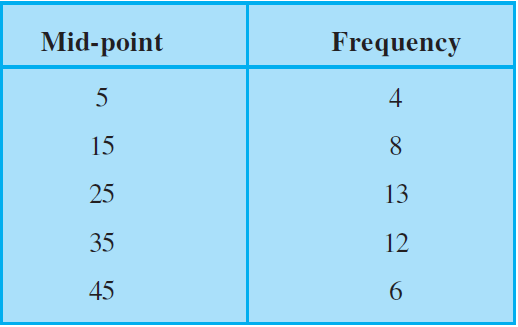
Prepare a continuous grouped frequency distribution from the following data:

NCERT Exemplar Solutions Class 9 Maths Chapter 14 Ex.14.3-1

Also find the size of class intervals.

Show solutionHide solution
Worked solution

If m is mid-point of a class and h is the class size,

We know that,

Lower limits of the class intervals = m – h/2

Upper limits of the class intervals = m + h/2.

Class size (h) = 15 – 5 = 10 …(i)

Then,

The class interval formed for the mid-point 5 = (5 – 10/2) – (5 + 10/2)

= 0 – 10

Continuing in the same manner, the continuous class table is:

Mid-point 0-10 10-20 20-30 30-40 40-50
Frequency 4 8 13 12 6

The size of class intervals = 10 (from equation 1)

Q5Written answer

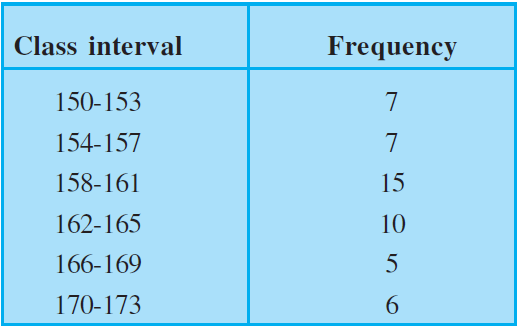
Convert the given frequency distribution into a continuous grouped frequency distribution:

NCERT Exemplar Solutions Class 9 Maths Chapter 14 Ex.14.3-2

In which intervals would 153.5 and 157.5 be included?

Show solutionHide solution
Worked solution

Consider the classes 150 – 153 and 154 – 157.

The lower limit of 154 – 157 = 154

The upper limit of 150 – 153 = 153

The difference = 154 – 153 = 1

Half the difference = 1/2 = 0.5

Therefore,

The new class interval formed from 150 – 153 = (150 – 0.5) – (153 + 0.5)

= 149.5 – 153.5.

Continuous classes formed can be represented in a table as:

Class Interval Frequency
149.5 – 153.5 7
153.5 – 157.5 7
157.5 – 161.5 15
161.5 – 165.5 10
165.5 – 169.5 5
169.5 – 173.5 6

Hence, from the table,

It is clear that 153.5 belongs to the class interval 153.5 – 157.5 and 157.5 belongs to the class interval 157.5 – 161.5.

Q6Written answer

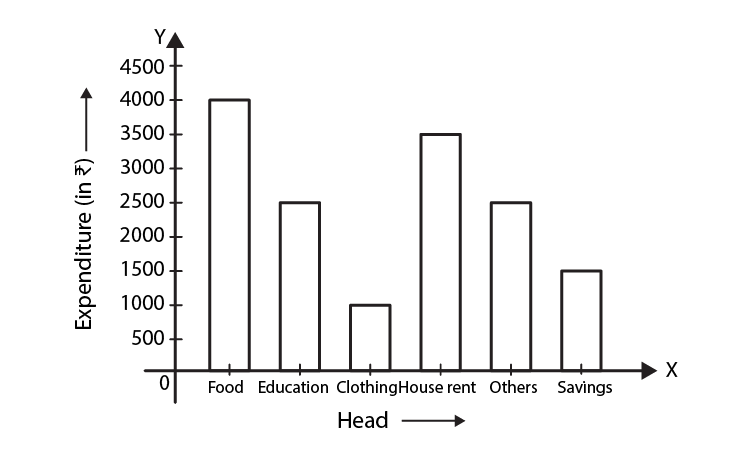
The expenditure of a family on different heads in a month is given below:

NCERT Exemplar Solutions Class 9 Maths Chapter 14 Ex.14.3-3

Draw a bar graph to represent the data above.

Show solutionHide solution
Worked solution

NCERT Exemplar Solutions Class 9 Maths Chapter 14 Ex.14.3-4

Q7Written answer

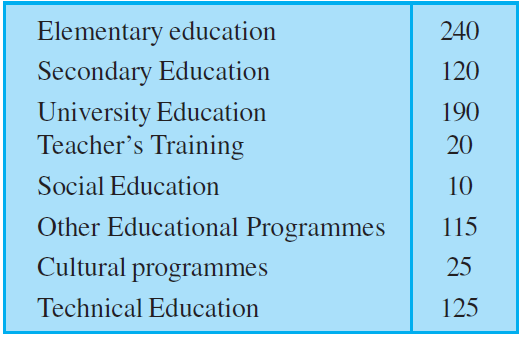
Expenditure on Education of a country during a five year period (2002-2006), in crores of rupees, is given below:

NCERT Exemplar Solutions Class 9 Maths Chapter 14 Ex.14.3-5

Represent the information above by a bar graph.

Show solutionHide solution
Worked solution

The given data can be represented by a bar graph as follows:

NCERT Exemplar Solutions Class 9 Maths Chapter 14 Ex.14.3-6

Q8Written answer

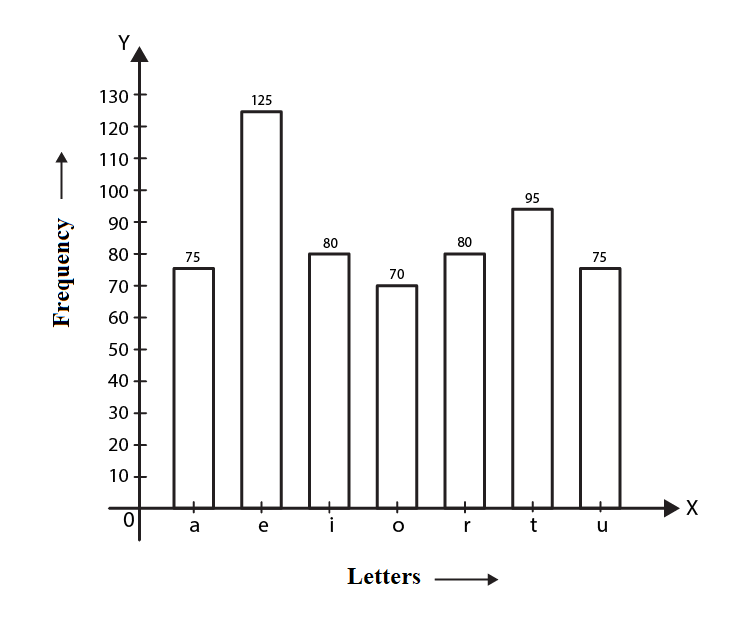
The following table gives the frequencies of most commonly used letters a, e, i, o, r, t, u from a page of a book:

NCERT Exemplar Solutions Class 9 Maths Chapter 14 Ex.14.3-7

Represent the information above by a bar graph.

Show solutionHide solution
Worked solution

The given data can be represented by a bar graph as follows:

NCERT Exemplar Solutions Class 9 Maths Chapter 14 Ex.14.3-8

Q9Written answer

If the mean of the following data is 20.2, find the value of p:

NCERT Exemplar Solutions Class 9 Maths Chapter 14 Ex.14.3-9

Show solutionHide solution
Worked solution

According to the question,

Mean = 20.2

So,

∑fixi/∑fi=20.2

So we get,

∑fixi = (10×6)+(15×8)+(20×p)+(25×10+)(30×6)

=610+20p

We also get,

∑fi=6+8+p+10+6

=30+p

Therefore,

∑fixi/∑fi=20.2

(610+20p)/30+p=20.2

20.2(30+p) =610+20p

606+20.2p=610+20p

20.2p-20p=610-606

0.2p=4

p=4/0.2

p=20

Q10Written answer

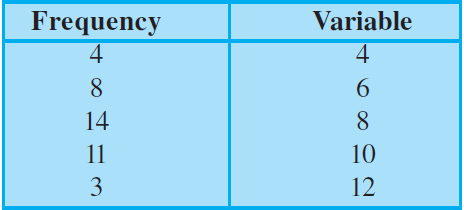
Obtain the mean of the following distribution:

NCERT Exemplar Solutions Class 9 Maths Chapter 14 Ex.14.3-10

Show solutionHide solution
Worked solution
xi fi xifi
4 4 16
6 8 48
8 14 112
10 11 110
12 3 36
Total 40 322

Mean = ∑xifi/∑fi = 322/40 = 8.05