My Cart
Your Cart 0

    Your cart is empty.

  • Total (Amount) ₹0.00
NCERT · Class 8 · Maths

Chapter 5: Data Handling

Practice each question, then open the answer or worked solution.

Exercise 5.1

Textbook page 76 · 5 questions
Q1Multiple choice

For which of these would you use a histogram to show the data?

Show solutionHide solution
Worked solution

We know that a Histogram is a graphical representation of data if the data is represented using class interval.

Since the cases mentioned in options (b) and (d) can be divided into class intervals, the histogram can be used to show the data.

Similarly, since the cases mentioned in options (a) and (c) cannot be divided into class intervals, histograms cannot be used to represent the data.
Q2Written answer

The shoppers who come to a departmental store are marked as man (M), woman (W), boy (B) or girl (G). The following list gives the shoppers who came during the first hour of the morning.

W W W G B W W M G G M M W W W W G B M W B G G M W W M M W W W M W B W G M W W W W G W M M W M W G W M G W M M B G G W.

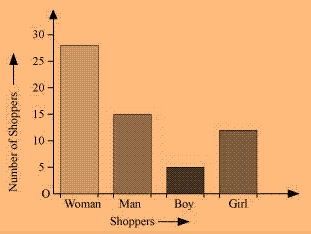
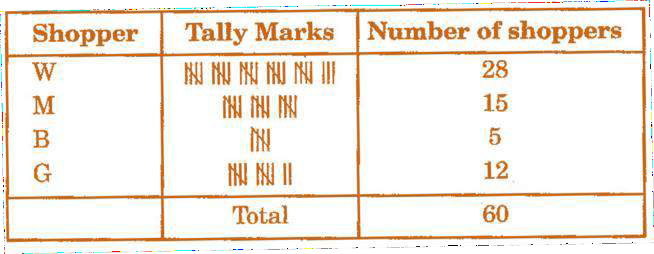
Make a frequency distribution table using tally marks. Draw a bar graph to illustrate it.

Show solutionHide solution
Worked solution

NCERT Solution For Class 8 Maths Chapter 5- 1Frequency distribution table:

Bar-graph:

NCERT Solution For Class 8 Maths Chapter 5- 2

Q3Written answer

The weekly wages (in ₹) of 30 workers in a factory are:

830, 835, 890, 810, 835, 836, 869, 845, 898, 890, 820, 860, 832, 833, 855, 845, 804, 808,

812, 840, 885, 835, 835, 836, 878, 840, 868, 890, 806, 840.

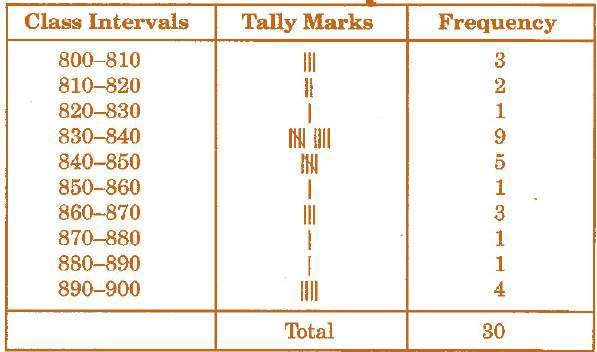
Using tally marks, make a frequency table with intervals as 800 – 810, 810 – 820 and so on.

Show solutionHide solution
Worked solution

NCERT Solution For Class 8 Maths Chapter 5- 3The frequency table with intervals as 800 – 810, 810 – 820 and so on, using tally marks, is given below:
Q4Written answer

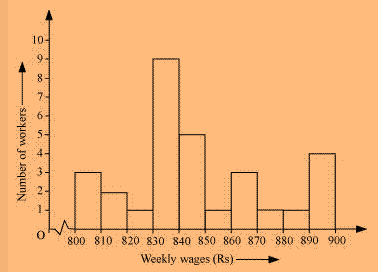
Draw a histogram for the frequency table made for the data in Question 3 and answer the following questions.

(i) Which group has the maximum number of workers?

(ii) How many workers earn ₹ 850 and more?

(iii) How many workers earn less than ₹ 850?

Show solutionHide solution
Worked solution

NCERT Solution For Class 8 Maths Chapter 5- 4

(i) 830-840 is the group having a maximum number of workers, 9, compared to other groups.

(ii) Workers earning ₹ 850 and more= 1+3+1+1+4=10

(iii) Workers earning less than ₹ 850= 3+2+1+9+5=20

Q5Written answer

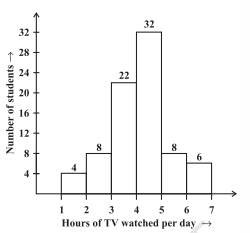
The number of hours for which students of a particular class watched television during holidays is shown in the given graph.

Answer the following:

(i) For how many hours did the maximum number of students watch TV?

(ii) How many students watched TV for less than 4 hours?

(iii) How many students spent more than 5 hours watching TV?

NCERT Solution For Class 8 Maths Chapter 5- 5

Show solutionHide solution
Worked solution

(i) 32 students watched TV for 4-5 hours. ∴ The maximum number of students who watched TV for 4 – 5 hours.

(ii) The number of students who watched TV less than 4 hours= 22+8+4=34

(iii) The number of students who spent more than 5 hours watching TV

=8+6=14