Q1Multiple choice
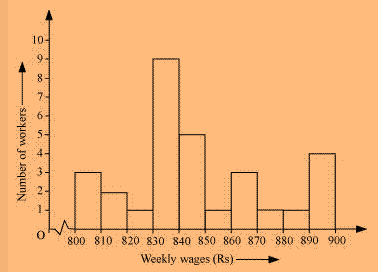
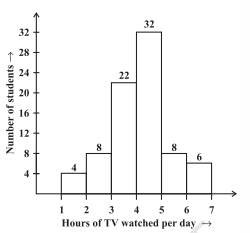
For which of these would you use a histogram to show the data?
Show solutionHide solution
Worked solution
We know that a Histogram is a graphical representation of data if the data is represented using class interval.
Since the cases mentioned in options (b) and (d) can be divided into class intervals, the histogram can be used to show the data.
Similarly, since the cases mentioned in options (a) and (c) cannot be divided into class intervals, histograms cannot be used to represent the data.
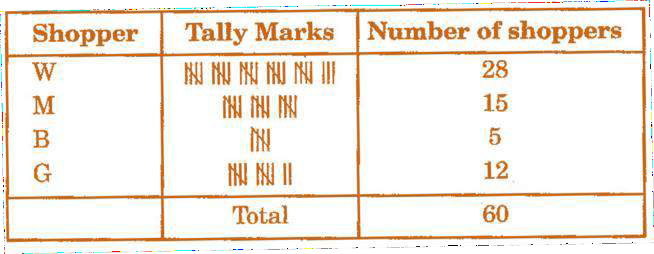 Frequency distribution table: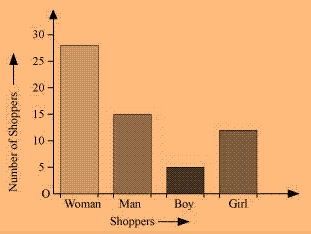
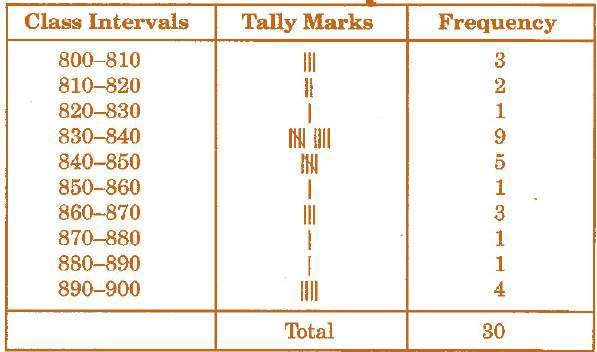 The frequency table with intervals as 800 – 810, 810 – 820 and so on, using tally marks, is given below: