Draw the graphs for the following tables of values, with suitable scales on the axes.
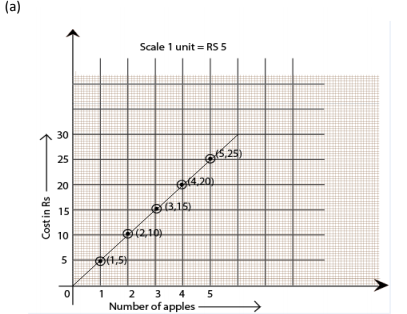
(a) Cost of apples.

(b) Distance travelled by car.

(i) How much distance did the car cover during the period 7.30 a.m. to 8 a.m.?
(ii) What was the time when the car had covered a distance of 100 km since its start?
(c) Interest on deposits for a year.

(i) Does the graph pass through the origin?
(ii) Use the graph to find the interest on Rs 2500 for a year.
(iii) To get an interest of Rs. 280 per year, how much money should be deposited?
Show solutionHide solution
Mark “number of apples” on the x-axis and “cost” on the y-axis. The graph is
(b) Represent the “time” on the x-axis and “distance” on the y-axis.
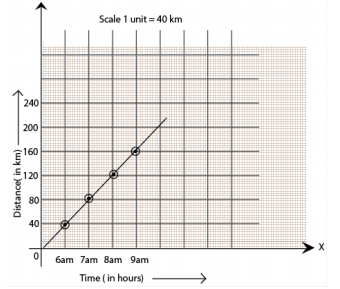
(i) The car covered a distance of 20 km.
(ii) It was 7.30 am, when it covered a distance of 100 km.
(c) Represent “Deposit” on the y-axis and “simple interest” on the x-axis.
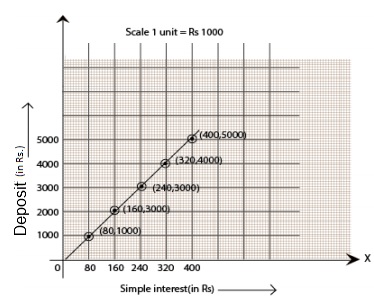
(i) Yes, the graph passes through the origin.
(ii) Interest on Rs. 2500 is Rs. 200 for a year.
(iii) Rs. 3500 should be deposited for the interest of Rs. 280.