My Cart
Your Cart 0

    Your cart is empty.

  • Total (Amount) ₹0.00
NCERT Exemplar · Class 9 · Maths

Chapter 4: Linear Equations in Two Variables

Practice each question, then open the answer or worked solution.

Exercise 4.4

Textbook page 41 · 3 questions
Q1Written answer

Show that the points A (1, 2), B ( – 1, – 16) and C (0, – 7) lie on the graph of the linear equation y = 9x – 7.

Show solutionHide solution
Worked solution

We have the equation,

y = 9x – 7

For A (1, 2),

Substituting the values of (x,y) = (1, 2),

We get,

2 = 9(1) – 7 = 9 – 7 = 2

For B (–1, –16),

Substituting the values of (x,y) = (–1, –16),

We get,

–16 = 9(–1) – 7 = – 9 – 7 = – 16

For C (0, –7),

Substituting the values of (x,y) = (0, –7),

We get,

– 7 = 9(0) – 7 = 0 – 7 = – 7

Hence, we find that the points A (1, 2), B (–1, –16) and C (0, –7) satisfies the line y = 9x – 7.

Hence, A (1, 2), B (–1, –16) and C (0, –7) are solutions of the linear equation y = 9x – 7

Therefore, points A (1, 2), B (–1, –16), C (0, –7) lie on the graph of linear equation y = 9x – 7.
Q2Written answer

The following observed value of x and y are thought to satisfy a linear equation. Write the linear equation-

x 6 – 6
y – 2 6

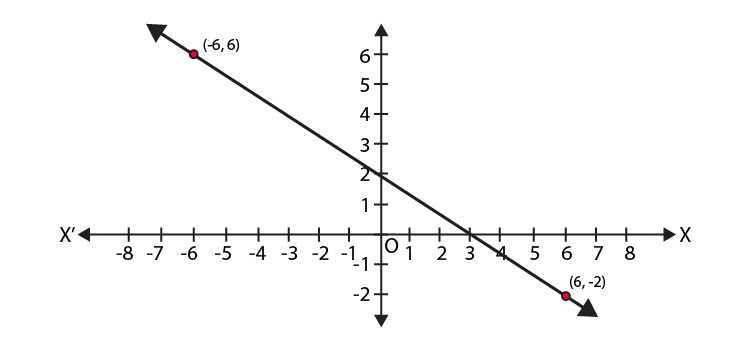
Draw the graph using the value of x, y as given in the above table. At what points the graph of the linear equation (i) cuts the X-axis? (ii) cuts the Y-axis?

Show solutionHide solution
Worked solution

NCERT Exemplar Class 9 Maths Chapter 4- Ex. 4.4 Question 2

We know that,

The linear equation of a line is,

y = mx + c, where, c is the y-intercept

From the graph,

We get y-intercept is 2.

⇒ c = 2.

Also, from the graph,

We get,

x1 = 6, y1 = – 2 and x2 = – 6, y2 = 6

We know that,

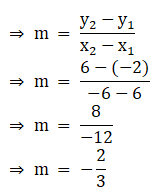
m = slope of the line

NCERT Exemplar Class 9 Maths Chapter 4- Ex. 4.4 Question 2-1

∴ we get the linear equation,

y = – (2/3)x + 2

Multiplying whole equation by 3, we get,

⇒ 3y = – 2x + 6

⇒ 2x + 3y – 6 = 0

Thus, the points the graph of the linear equation cuts

(i)x-axis

Since, the point is on x axis, we have, y = 0.

Substituting y = 0 in the equation, 2x + 3y – 6 = 0,

We get,

2x + 3×0 – 6 = 0

⇒ 2x = 6

⇒ x = 3

Hence, the point at which the graph cuts x-axis = (3, 0).

(ii) y-axis

Since, the point is on y axis, we have, x = 0.

Substituting x = 0 in the equation, 2x + 3y – 6 = 0,

We get,

2×0 + 3y – 6 = 0

⇒ 3y = 6

⇒ y = 2

Hence, the point at which the graph cuts x-axis = (0, 2).

Q3Written answer

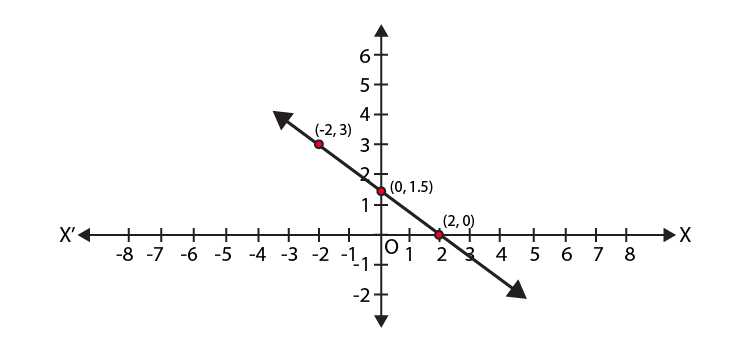
Draw the graph of the linear equation 3x + 4y = 6. At what points, the graph cuts X and Y-axis?

Show solutionHide solution
Worked solution

According to the question,

We get the equation,

3x + 4y = 6.

We need at least 2 points on the graph to draw the graph of this equation,

Thus, the points the graph cuts

(i) x-axis

Since, the point is on x axis, we have, y = 0.

Substituting y = 0 in the equation, 3x + 4y = 6,

We get,

3x + 4×0 = 6

⇒ 3x = 6

⇒ x = 2

Hence, the point at which the graph cuts x-axis = (2, 0).

(ii) y-axis

Since, the point is on y axis, we have, x = 0.

Substituting x = 0 in the equation, 3x + 4y = 6,

We get,

3×0 + 4y = 6

⇒ 4y = 6

⇒ y = 6/4

⇒ y = 3/2

⇒ y = 1.5

Hence, the point at which the graph cuts the x-axis = (0, 1.5).

Plotting the points (0, 1.5) and (2, 0) on the graph.

NCERT Exemplar Class 9 Maths Chapter 4- Ex. 4.4 Question 3