My Cart
Your Cart 0

    Your cart is empty.

  • Total (Amount) ₹0.00
NCERT Exemplar · Class 7 · Maths

Chapter 3: Data Handling

Practice each question, then open the answer or worked solution.

Questions

46 questions
Q11Written answer

Some integers are marked on a board. What is the range of these integers?
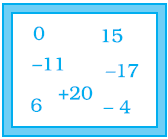
NCERT Exemplar Class 7 Maths Solutions Chapter 3 Image 3

(a) 31 (b) 37 (c) 20 (d) 3

Show solutionHide solution
Worked solution

Solution:-

(b) 37

The difference between the highest and lowest observations in a given data is called its Range.

Range = Highest – lowest

= 20 – (- 17)

= 20 + 17

= 37

Q12Written answer

On tossing a coin, the outcome is

(a) only head

(b) only tail

(c) neither head nor tail

(d) either head or tail

Show solutionHide solution
Worked solution

Solution:-

(d) either head or tail

Q13Written answer

The mean of three numbers is 40. All the three numbers are different natural numbers. If the lowest is 19, what could be the highest possible number of the remaining two numbers?

(a) 81 (b) 40 (c) 100 (d) 71

Show solutionHide solution
Worked solution

Solution:-

(a) 81

From the question it is given that,

The mean of three numbers is 40.

Lowest number = 19

Let us assume the other two numbers be P, Q.

Then,

Mean = (P + Q + 19)/3

40 = (P + Q + 19)/3

By cross multiplication we get,

120 = P + Q + 19

120 – 19 = P + Q

Then, P + Q = 101

So, 81 + 20 = 101

Therefore, the highest number is 81

Q14Written answer

Khilona earned scores of 97, 73 and 88, respectively, in her first three examinations. If she scored 80 in the fourth examination, then her average score will be

(a) increased by 1 (b) increased by 1.5

(c) decreased by 1 (d) decreased by 1.5

Show solutionHide solution
Worked solution

Solution:-

(d) decreased by 1.5

From the question,

Khilona earned scores in 3 exam = 97, 73, 88

Then, Mean = (97 + 73 + 88 +)/3

Mean = 86 marks

Khilona earned scores in 4 exam = 97, 73, 88, 80

Then, Mean = (97 + 73 + 88 + 80)/4

Mean = 84.5 marks

Then, her average score will be 86 – 84.5 = 1.5, decreased by 1.5

Q15Written answer

Which measure of central tendency best represents the data of the most popular politician after a debate?

(a) Mean (b) Median (c) Mode (d) Any of the above

Show solutionHide solution
Worked solution

Solution:-

(c) Mode

Mode is the observation that occurs most frequently in the data.

Q16Written answer

Which of the following has the same mean, median and mode?

(a) 6, 2, 5, 4, 3, 4, 1 (b) 4, 2, 2, 1, 3, 2, 3

(c) 2, 3, 7, 3, 8, 3, 2 (d) 4, 3, 4, 3, 4, 6, 4

Show solutionHide solution
Worked solution

Solution:-

(d) 4, 3, 4, 3, 4, 6, 4

Mean of the given data = (4 + 3 + 4 + 3 + 4 + 6 + 4)/7

= 4

Mode is the observation that occurs most frequently in the data i.e. 4.

When the given data is arranged in ascending (or descending) order, then the middlemost observation is the median of the data.

Arranging the given data, 3, 3, 4, 4, 4, 4, 6.

So, the median is 4.

In Questions 17 to 31, fill in the blanks to make the statements true.

Q17Written answer

The difference between the highest and the lowest observations of a data is called _________.

Show solutionHide solution
Worked solution

Solution:-

The difference between the highest and the lowest observations of a data is called range.

Q18Written answer

The mean of a data is defined as _________.

Show solutionHide solution
Worked solution

Solution:-

The average or Arithmetic Mean or mean of a given data is defined as Sum of all observations by the Number of observations.

Q19Written answer

In a set of observations, the observation that occurs the most often is called _________.

Show solutionHide solution
Worked solution

Solution:-

Mode

Mode is the observation that occurs most frequently in the data.

Q20Written answer

In a given data, arranged in ascending or descending order, the middle most observation is called _________.

Show solutionHide solution
Worked solution

Solution:-

Median.

When the given data is arranged in ascending (or descending) order, then the middlemost observation is the median of the data.