My Cart
Your Cart 0

    Your cart is empty.

  • Total (Amount) ₹0.00
NCERT Exemplar · Class 7 · Maths

Chapter 3: Data Handling

Practice each question, then open the answer or worked solution.

Questions

46 questions
Q1Written answer

Let x, y, z be three observations. The mean of these observations is

(a) (x × y × z)/3 (b) (x + y + z)/3
(c) (x – y – z)/3 (d) (x × y + z)/3

Show solutionHide solution
Worked solution

Solution:-

(b) (x + y + z)/3

The average or Arithmetic Mean or mean of a given data is defined as Sum of all observations by the Number of observations.
Q2Written answer

The number of trees in different parks of a city are 33, 38, 48, 33, 34, 34, 33 and 24. The mode of this data is

(a) 24 (b) 34 (c) 33 (d) 48

Show solutionHide solution
Worked solution

Solution:-

(c) 33

Mode is the observation that occurs most frequently in the data.

Q3Written answer

Which measures of central tendency get affected if the extreme observations on both the ends of a data arranged in descending order are removed?

(a) Mean and mode (b) Mean and Median

(c) Mode and Median (d) Mean, Median and Mode

Show solutionHide solution
Worked solution

Solution:-

(a) Mean and mode

Q4Written answer

The range of the data: 21, 6, 17, 18, 12, 8, 4, 13 is

(a) 17 (b) 12 (c) 8 (d) 15

Show solutionHide solution
Worked solution

Solution:-

(a) 17

The difference between the highest and lowest observations in a given data is called its Range.

Range = Highest – lowest

= 21 – 4

= 17

Q5Written answer

The median of the data: 3, 4, 5, 6, 7, 3, 4 is

(a) 5 (b) 3 (c) 4 (d) 6

Show solutionHide solution
Worked solution

Solution:-

(c) 4

When the given data is arranged in ascending (or descending) order, then the middlemost observation is the median of the data.

So, now arrange the given observation into ascending order 3, 3, 4, 4, 5, 6, 7

Therefore, 4 is the middlemost observation, and it is the median of the data.

Q6Written answer

Out of 5 brands of chocolates in a shop, a boy has to purchase the brand which is most liked by children. What measure of central tendency would be most appropriate if the data is provided to him?

(a) Mean (b) Mode

(c) Median (d) Any of the three

Show solutionHide solution
Worked solution

Solution:-

(b) Mode

Mode is the observation that occurs most frequently in the data.

Q7Written answer

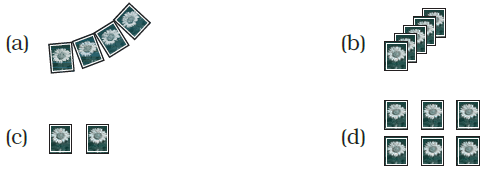
There are 2 aces in each of the given set of cards placed face down. From which set are you certain to pick the two aces in the first go?

NCERT Exemplar Class 7 Maths Solutions Chapter 3 Image 1

Show solutionHide solution
Worked solution

Solution:-

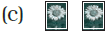
NCERT Exemplar Class 7 Maths Solutions Chapter 3 Image 2

The probability of picking the two aces in the first go is in option (c).

Q8Written answer

In the previous question, what is the probability of picking up an ace from set (d)?

(a) 1/6 (b) 2/6 (c) 3/6 (d) 4/6

Show solutionHide solution
Worked solution

Solution:-

(b) 2/6

Probability of picking up an ace from set = Number of ace in the set/ Total number of cards in the set.

Q9Written answer

The difference between the highest and the lowest observations in a data is its

(a) frequency (b) width (c) range (d) mode

Show solutionHide solution
Worked solution

Solution:-

(c) Range

Q10Written answer

In a school, only 2 out of 5 students can participate in a quiz. What is the chance that a student picked at random makes it to the competition?

(a) 20% (b) 40% (c) 50% (d) 30%

Show solutionHide solution
Worked solution

Solution:-

(b) 40%

From the question it is given that, in a school, only 2 out of 5 students can participate in a quiz.

So, the chance that a student picked at random = 2/5

Then percentage = 2/5 × 100

= 0.4 × 100

= 40 %