My Cart
Your Cart 0

    Your cart is empty.

  • Total (Amount) ₹0.00
Previous year question hub

Geometry - General Aptitude (GA) Previous Year Questions

Practice Geometry - General Aptitude (GA) previous year questions organised from real papers, with year-wise coverage and clear topic navigation.

8Papers
8Years
10Questions
1Topics

Geometry question pattern

Every graph below is calculated only from this selection.

Questions by year

Compare question counts across years.

Difficulty distribution

How the classified questions are distributed by difficulty.

Medium 6 60%
Easy 4 40%

Question type distribution

MCQ, numerical, multiple-select and other formats found in these papers.

MCQ 10 100%

Subject weightage

Top subjects by unique question coverage.

General Aptitude (GA)
10 Qs

Most asked topics

Top topics across the included previous year papers.

Geometry
10 Qs

Subtopic coverage

Top subtopics inside this exact selection.

Polygons
2 Qs
Triangles
2 Qs
Rectangles
1 Qs
Circles
1 Qs
Curves
1 Qs
Lines
1 Qs
Parallelograms
1 Qs
Symmetry
1 Qs

Paper coverage

Question coverage for the most populated papers. Every active PYP paper remains listed below.

Ecology and Evolution (EY) 2025
1 Qs
Ecology and Evolution (EY) 2024
1 Qs
Ecology and Evolution (EY) 2023
3 Qs
Ecology and Evolution (EY) 2022
1 Qs
Ecology and Evolution (EY) 2021
1 Qs
Ecology and Evolution (EY) 2020
1 Qs
Ecology and Evolution (EY) 2018
1 Qs
Ecology and Evolution (EY) 2017
1 Qs

Browse by subtopics

Open a focused page built from the same verified paper data.

Included previous year papers

Newest papers appear first. Search these papers or sort by year and name.

Paper nameYearPDFAttempt
Ecology and Evolution (EY) 20252025
1 questions in this view
2025
Ecology and Evolution (EY) 20242024
1 questions in this view
2024
Ecology and Evolution (EY) 20232023
3 questions in this view
2023
Ecology and Evolution (EY) 20222022
1 questions in this view
2022
Ecology and Evolution (EY) 20212021
1 questions in this view
2021
Ecology and Evolution (EY) 20202020
1 questions in this view
2020
Ecology and Evolution (EY) 20182018
1 questions in this view
2018
Ecology and Evolution (EY) 20172017
1 questions in this view
2017

Sample previous year questions

A varied preview from the papers represented in this selection, with every available option.

1
2018 · General Aptitude (GA) · Geometry · Rectangles
Ecology and Evolution (EY) 2018
A rectangle becomes a square when its length and breadth are reduced by 10 m and 5 m, respectively. During this process, the rectangle loses 650 m² of area. What is the area of the original rectangle in square meters?
Open complete paper
2
2020 · General Aptitude (GA) · Geometry · Circles
Ecology and Evolution (EY) 2020
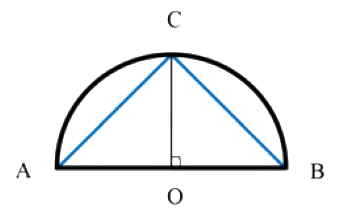
Given a semicircle with O as the centre, as shown in the figure, the ratio \(\frac{\overline{AC}+\overline{CB}}{\overline{AB}}\) is ______, where \(\overline{AC}\), \(\overline{CB}\) and \(\overline{AB}\) are chords.

Question diagram

Open complete paper
3
2021 · General Aptitude (GA) · Geometry · Polygons
Ecology and Evolution (EY) 2021

For a regular polygon having 10 sides, the interior angle between the sides of the polygon, in degrees, is:

Open complete paper
4
2024 · General Aptitude (GA) · Geometry · Triangles
Ecology and Evolution (EY) 2024

During a half-moon phase, the Earth-Moon-Sun form a right triangle. If the Moon-Earth-Sun angle at this half-moon phase is measured to be 89.85°, the ratio of the Earth-Sun and Earth-Moon distances is closest to

Open complete paper
5
2025 · General Aptitude (GA) · Geometry · Triangles
Ecology and Evolution (EY) 2025
A stick of length one meter is broken at two locations at distances of \(b_1\) and \(b_2\) from the origin (0), as shown in the figure. Note that \(0 < b_1 < b_2 < 1\). Which one of the following is NOT a necessary condition for forming a triangle using the three pieces?
Note: All lengths are in meter. The figure shown is representative.
Open complete paper
6
2017 · General Aptitude (GA) · Geometry · Curves
Ecology and Evolution (EY) 2017
A contour line joins locations having the same height above the mean sea level. The following is a contour plot of a geographical region. Contour lines are shown at 25 m intervals in this plot. The path from P to Q is best described by

Question diagram

Open complete paper