My Cart
Your Cart 0

    Your cart is empty.

  • Total (Amount) ₹0.00
NCERT Exemplar · Class 8 · Maths

Chapter 2: Data Handling

Practice each question, then open the answer or worked solution.

Some questions are missing from the current source. Exercise · Page 42: questions 88 missing from source

Exercise · Page 42

Textbook page 42 · 115 questions
Q81Written answer

The following pictorial representation of data is a histogram.

NCERT Exemplars Class 8 Maths Solutions Chapter 2 Image 11

Show solutionHide solution
Worked solution

Solution:-

True.

Histogram is a type of bar diagram, where the class intervals are shown on the horizontal axis and the heights of the bars (rectangles) show the frequency of the class interval, but there is no gap between the bars as there is no gap between the class intervals.

Q82Written answer

Given below is a frequency distribution table. Read it and answer the question that follows.

Class Interval Frequency
10 – 20 5
20 – 30 10
30 – 40 4
40 – 50 15
50 – 60 12

(a) What is the lower limit of the second class interval?

Show solutionHide solution
Worked solution

Solution:-

The lower limit of the second class interval 20 – 30 is 20.

(b) What is the upper limit of the last class interval?

Solution:-

The upper limit of the last class interval 50 – 60 is 60.


(c) What is the frequency of the third class?

Solution:-

The frequency of the third class 30 – 40 is 4.


(d) Which interval has a frequency of 10?

Solution:-

Second class interval 20 – 30 has a frequency of 10.

(e) Which interval has the lowest frequency?

Solution:-

Third interval 30 – 40 has the lowest frequency i.e. 4.

(f) What is the class size?

Solution:-

The difference between the upper and lower limit of a class interval is called the Size of the class interval.

Size = Upper limit – Lower limit

= 20 – 10

= 10

Q83Written answer

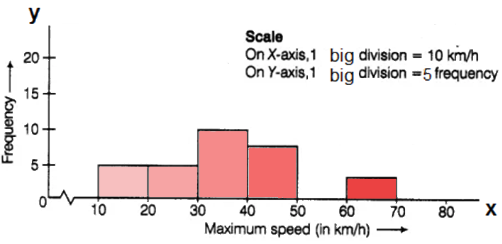
The top speeds of thirty different land animals have been organised into a frequency table. Draw a histogram for the given data.

Maximum Speed (Km/h) Frequency
10 – 20 5
20 – 30 5
30 – 40 10
40 – 50 8
50 – 60 0
60 – 70 2
Show solutionHide solution
Worked solution

Solution:-

Histogram is a type of bar diagram, where the class intervals are shown on the horizontal axis and the heights of the bars (rectangles) show the frequency of the class interval, but there is no gap between the bars as there is no gap between the class intervals.

NCERT Exemplars Class 8 Maths Solutions Chapter 2 Image 12

Q84Written answer

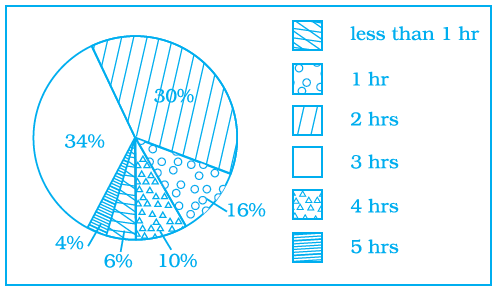
Given below is a pie chart showing the time spend by a group of 350 children in different games. Observe it and answer the questions that follow.

NCERT Exemplars Class 8 Maths Solutions Chapter 2 Image 13

(a) How many children spend at least one hour in playing games?

Show solutionHide solution
Worked solution

Solution:-

From the given pie chart,

Percentage of children who at least spend one hour in playing = 16 + 30 + 34 + 10 + 4

= 94 %

Number of children out of 350 who at least spend one hour in playing = (94/100) × 350

= 0.94 × 350

= 329 children

(b) How many children spend more than 2 hours in playing games?

Solution:-

From the given pie chart,

Percentage of children who spend 2 hours in playing = 34 + 10 + 4

= 48 %

Number of children out of 350 who at least spend one hour in playing = (48/100) × 350

= 0.48 × 350

= 168 children

(c) How many children spend 3 or lesser hours in playing games?

Solution:-

From the given pie chart,

Percentage of children who at least spend one hour in playing = 6 + 16 + 30 + 34

= 86 %

Number of children out of 350 who at least spend one hour in playing = (86/100) × 350

= 0.86 × 350

= 301 children

(d) Which is greater — number of children who spend 2 hours or more per day or number of children who play for less than one hour?

Solution:-

Number of children who spend 2 hours or more per day = 30 + 34 + 10 + 4 = 78%

= (78/100) × 350

= 0.78 × 350

= 273 children

Number of children who play for less than one hour = 6%

= (6/100) × 350

= 0.06 × 350

= 21 children

So, by comparing both it is clear that number of children who spend 2 hours or more per day is greater

Q85Written answer

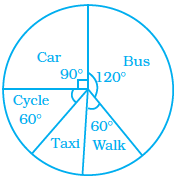
The pie chart on the right shows the result of a survey

Carried out to find the modes of travel used by the children to go

to school. Study the pie chart and answer the questions that

follow.

NCERT Exemplars Class 8 Maths Solutions Chapter 2 Image 14

(a) What is the most common mode of transport?

Show solutionHide solution
Worked solution

Solution:-

By observing the given pie chart the most common mode of transport is Bus i.e. its central angle is 120o.

(b) What fraction of children travel by car?

Solution:-

By observing the given pie chart, central angle of the children travel by car is 90o.

Then,

The fraction of children travel by car,

= (90o/360o)

= 9/36 … [divide both numerator and denominator by 9]

= ¼


(c) If 18 children travel by car, how many children took part in the survey?

Solution:-

Let us assume total number of children took part in the survey be y

Number of children travel by car = (¼) of total number of children

18 = ¼ × y

Y = 18 × 4

Y = 72

So, 72 children took part in the survey.

(d) How many children use taxi to travel to school?

Solution:-

Central angle of children use taxi to travel to school = (360o – (120o + 60o + 90o + 60o)

= (360o – 330o)

= 30o

Then,

Out of 72 children number of children use taxi to travel to school = (30o/360o) × 72

= 6

(e) By which two modes of transport are equal number of children travelling?

Solution:-

By observing the given pie chart, cycle and walk are the two modes of transport are equal number of children travelling. Because, central angle of the two modes are same i.e. 60o.

Q86Written answer

A dice is rolled once. What is the probability that the number on top will be

(a) Odd

(b) Greater than 5

(c) A multiple of 3

(d) Less than 1

(e) A factor of 36

(f) A factor of 6

Show solutionHide solution
Worked solution

Solution:-

A dice is rolled once, the possible outcomes are 1, 2, 3, 4, 5 and 6.

Then,

The probability that the number on top will be

(a) Odd

Odd numbers in the dice are 1, 3, 5

Then,

Probability = total number of odd numbers/ Total number of outcomes

= 3/6 … [divide numerator and denominator by 3]

= ½

(b) Greater than 5

Greater than 5 is 6

Then,

Probability = total number Greater than 5/ Total number of outcomes

= 1/6

(c) A multiple of 3

Multiple of 3 = 3 and 6

Then,

Probability = total number of multiple of 3/ Total number of outcomes

= 2/6 … [divide numerator and denominator by 2]

= 1/3

(d) Less than 1

There is no number is less than 1.

So, probability of less than 1 = 0

(e) A factor of 36

Factors of 36 are 1, 2, 3, 4 and 6

Probability = total number of factor of 36/ Total number of outcomes

= 5/6

(f) A factor of 6

Factors of 6 are 1, 2, 3 and 6

Probability = total number of factor of 6/ Total number of outcomes

= 4/6 … [divide numerator and denominator by 2]

= 2/3
Q87Written answer

Classify the following statements under appropriate headings.

(a) Getting the sum of angles of a triangle as 180°.

(b) India winning a cricket match against Pakistan.

(c) Sun setting in the evening.

(d) Getting 7 when a die is thrown.

(e) Sun rising from the west.

(f) Winning a racing competition by you.

Certain to happen Impossible to happen May or may not happen
Show solutionHide solution
Worked solution

Solution:-

(a) It is certain to happen. Because, the sum of angles of a triangle as 180o.

(b) It may or may not happen. Because, the result of match is unpredictable.

(c) It is certain to happen. Because, the sun always sets in the evening.

(d) It is impossible to happen. Because, 7 is not an outcome when a dice is thrown.

(e) It is impossible to happen. Because, Sun always rises from the east.

(f) It may or may not happen. Because, the result is unpredictable.

Q89Written answer

Ritwik draws a ball from a bag that contains white and yellow balls. The probability of choosing a white ball is 2/9. If the total number of balls in the bag is 36, find the number of yellow balls.

Show solutionHide solution
Worked solution

Solution:-

From the question is given that,

Probability of choosing a white ball is = 2/9

The total number of balls in the bag is = 36

Number of white ball chosen = (2/9) × 36

= 8 white balls

Then, the number of yellow balls = Total balls in bag – number of white balls

= 36 – 8

= 28 yellow balls

Q90Written answer

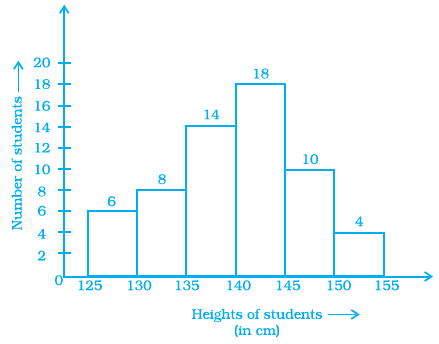
Look at the histogram below and answer the questions that follow.

NCERT Exemplars Class 8 Maths Solutions Chapter 2 Image 15

(a) How many students have height more than or equal to 135 cm but less than 150 cm?

Show solutionHide solution
Worked solution

Solution:-

By observing the given histogram,

Students have height more than or equal to 135 cm but less than 150 = 14 + 18 + 10

= 42

(b) Which class interval has the least number of students?

Solution:-

150 – 155 has the least number of students i.e. 4.

(c) What is the class size?

Solution:-

The difference between the upper and lower limit of a class interval is called the

Size of the class interval.

Size = Upper limit – Lower limit

= 130 – 125

= 5

(d) How many students have height less than 140 cm?

Solution:-

By observing the given histogram,

Students have height less than 140 cm = 6 + 8 + 14

= 28

Q91Written answer

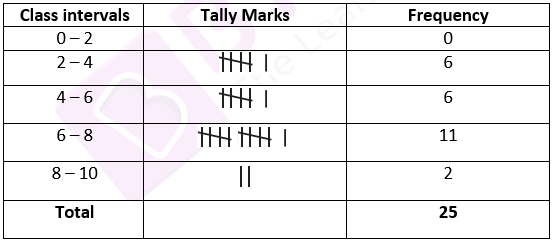
Following are the number of members in 25 families of a village:

6, 8, 7, 7, 6, 5, 3, 2, 5, 6, 8, 7, 7, 4, 3, 6, 6, 6, 7, 5, 4, 3, 3, 2, 5. Prepare a frequency distribution table for the data using class intervals 0 –2, 2 –4, etc.

Show solutionHide solution
Worked solution

Solution:-

First, we have to arrange the number of members in 25 families of a village in ascending order.

= 2, 2, 3, 3, 3, 3, 4, 4, 5, 5, 5, 5, 6, 6, 6, 6, 6, 6, 7, 7, 7, 7, 7, 8, 8.

Now, we will draw the frequency table of the given data.

NCERT Exemplars Class 8 Maths Solutions Chapter 2 Image 16