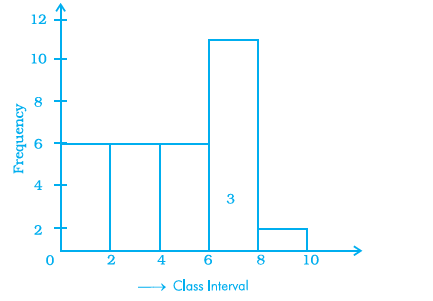
Draw a histogram to represent the frequency distribution in question 91.
Show solutionHide solution
Solution:-
Scale:
On X – axis, 1 big division = 2 member
On Y – axis, 1 big division = 2 family

Your cart is empty.
Practice each question, then open the answer or worked solution.
Draw a histogram to represent the frequency distribution in question 91.
Solution:-
Scale:
On X – axis, 1 big division = 2 member
On Y – axis, 1 big division = 2 family

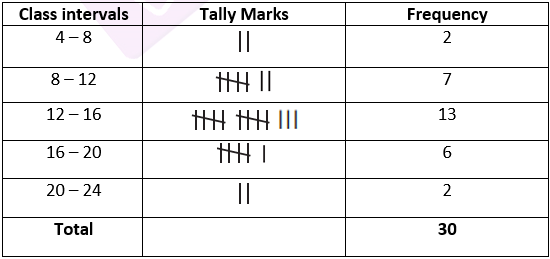
The marks obtained (out of 20) by 30 students of a class in a test are as follows:
14, 16, 15, 11, 15, 14, 13, 16, 8, 10, 7, 11, 18, 15, 14, 19, 20, 7, 10, 13, 12, 14, 15, 13, 16, 17, 14, 11, 10, 20.
Prepare a frequency distribution table for the above data using class intervals of equal width in which one class interval is 4 –8 (excluding 8 and including 4).
Solution:-
First, we have to arrange marks obtained (out of 20) by 30 students in ascending order.
= 7, 7, 8, 10, 10, 10, 11, 11, 11, 12, 13, 13, 13, 14, 14, 14, 14, 14, 15, 15, 15, 15, 16, 16, 16, 17, 18, 19, 20, 20.
Now, we will draw the frequency table of the given data.

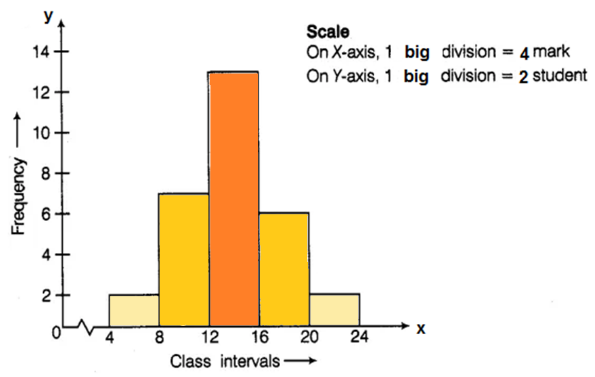
Prepare a histogram from the frequency distribution table obtained in question 93.
Solution:-
Scale:
On X – axis, 1 big division = 4 marks
On Y – axis, 1 big division = 2 students
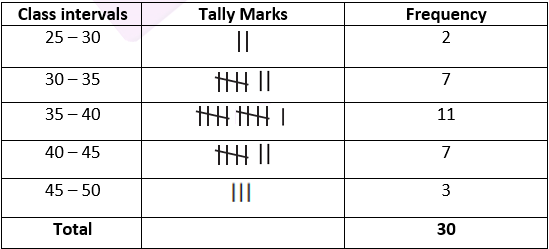
The weights (in kg) of 30 students of a class are:
39, 38, 36, 38, 40, 42, 43, 44, 33, 33, 31, 45, 46, 38, 37, 31, 30, 39, 41, 41, 46, 36, 35, 34, 39, 43, 32, 37, 29, 26.
Prepare a frequency distribution table using one class interval as (30 – 35), 35 not included.
(i) Which class has the least frequency?
(ii) Which class has the maximum frequency?
Solution:-
First, we have to arrange the weights (in kg) of 30 students of a class in ascending order.
= 26, 29, 30, 31, 31, 32, 33, 33, 34, 35, 36, 36, 37, 37, 38, 38, 38, 39, 39, 39, 40, 41, 41, 42, 43, 43, 44, 45, 46, 46
Now, we will draw the frequency table of the given data.

(i) Class first has the least frequency.
(ii) Class third has the maximum frequency.
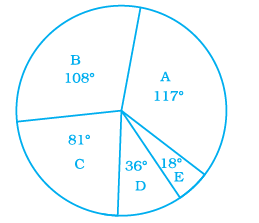
Shoes of the following brands are sold in Nov. 2007 at a shoe store. Construct a pie chart for the data.
| Brand | Number of pair of shoes sold |
| A | 130 |
| B | 120 |
| C | 90 |
| D | 40 |
| E | 20 |
Solution:-
From the table,
Total number of pairs of shoes sold = 130 + 120 + 90 + 40 +20
= 400
Central angle of pie chart for each brands,
A = (130/400) × 360o
= 117o
B = (120/400) × 360o
= 108o
C = (90/400) × 360o
= 81o
D = (40/400) × 360o
= 36o
E = (20/400) × 360o
= 18o
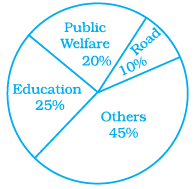
The following pie chart depicts the expenditure of a state government under different heads.

(i) If the total spending is 10 crores, how much money was spent on roads?
Solution:-
Given, total amount spent by state government under different heads = 10 crores
From the given pie chart,
Percentage of money spent on Roads = 10 %
Total money spent on Roads = (10/100) × 100000000
= 1,00,00,000
(ii) How many times is the amount of money spent on education compared to the amount spent on roads?
Solution:-
Given, the total amount spent by the state government under different heads = 10 crores
From the given pie chart,
Percentage of money spent on Roads = 10 %
Total money spent on Roads = (10/100) × 100000000
= ₹ 1,00,00,000
Percentage of money spent on Education = 25 %
Total money spent on Education = (25/100) × 100000000
= ₹ 2,50,00,000
Then,
= Total money spent on Education/ Total money spent on Roads
= ₹ 2,50,00,000/₹ 1,00,00,000
= ₹ 25/10
∴Money spent on education is 2.5 times of money spent on roads.
(iii) What fraction of the total expenditure is spent on both roads and public welfare together?
Solution:-
Given, the total amount spent by the state government under different heads = 10 crores
From the given pie chart,
Percentage of money spent on Roads = 10 %
Percentage of money spent on Public Welfare = 20 %
So,
Fraction of the total expenditure is spent on both roads and public welfare together,
= 10% + 20%
= (10/100) + (20/100)
= (1/10) + (2/10)
= (3/10)
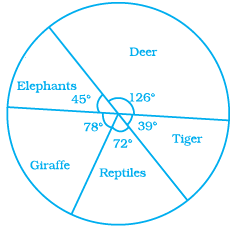
The following data represents the different numbers of animals in a zoo. Prepare a pie chart for the given data.
| Animals | Number of animals |
| Deer | 42 |
| Elephant | 15 |
| Giraffe | 26 |
| Reptiles | 24 |
| Tiger | 13 |
Solution:-
From the table,
Total number of animals in a zoo = 42 + 15 + 26 + 24 +13
= 120
Central angle of pie chart for each animals,
Deer= (42/120) × 360o
= 126o
Elephant = (15/120) × 360o
= 45o
Giraffe = (26/120) × 360o
= 78o
Reptiles = (24/120) × 360o
= 72o
Tiger = (13/120) × 360o
= 39o
Playing cards
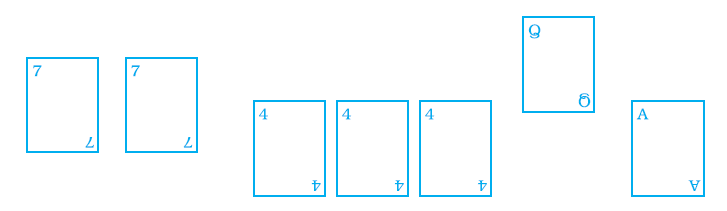
(a) From a pack of cards, the following cards are kept face down:
[Queen, King and Jack cards are called face cards.]

Suhail wins if he picks up a face card. Find the probability of Suhail winning.
Solution:-
From the above figure,
Number of face cards = 1
Total number of cards = 7
Number of outcomes = 7
Probability = Number of face cards / Total number cards
= 1/7
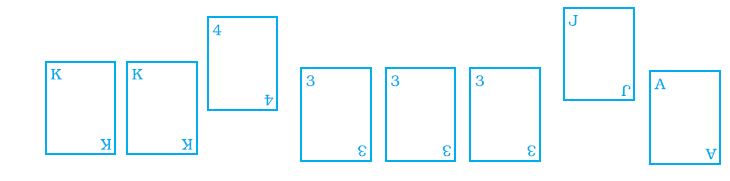
(b) Now the following cards are added to the above cards:

What is the probability of Suhail winning now? Reshma wins if she picks up a 4. What is the probability of Reshma winning?
[Queen, King and Jack cards are called face cards.]
Solution:-
Number of face cards = 4
Total number of cards = 15
Number of outcomes = 15
Probability = Number of face cards / Total number of cards
= 4/15
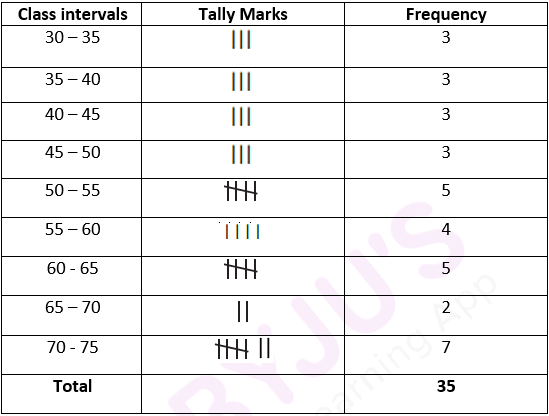
Construct a frequency distribution table for the following weights (in grams) of 35 mangoes, using equal class intervals; one of them is 40 – 45 (45 not included).
30, 40, 45, 32, 43, 50, 55, 62, 70, 70, 61, 62, 53, 52, 50, 42, 35, 37, 53, 55, 65, 70, 73, 74, 45, 46, 58, 59, 60, 62, 74, 34, 35, 70, 68.
(a) How many classes are there in the frequency distribution table?
(b) Which weight group has the highest frequency?
Solution:-
First, we have to arrange the weights (in grams) of 35 mangoes in ascending order.
= 30, 32, 34, 35, 35, 37, 40, 42, 43, 45, 45, 46, 50, 50, 52, 53, 53, 55, 55, 58, 59, 60, 61, 62, 62, 62, 65, 68, 70, 70, 70, 70, 73, 74, 74.
Now, we will draw the frequency table of the given data.

(a) There are nine classes in the frequency distribution table.
(b) 70 – 75 weight has the highest frequency.
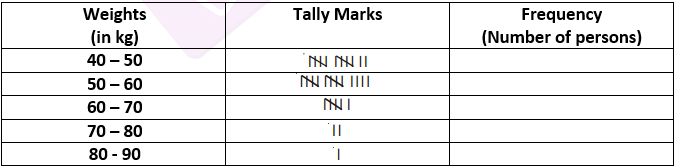
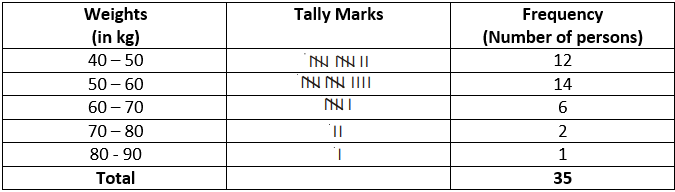
Complete the following table:

Find the total number of persons whose weights are given in the above table.
Solution:-