My Cart
Your Cart 0

    Your cart is empty.

  • Total (Amount) ₹0.00
NCERT Exemplar · Class 8 · Maths

Chapter 12: Introduction to Graphs

Practice each question, then open the answer or worked solution.

Questions

50 questions
Q41Written answer

Write the x -coordinate (abscissa) of each of the given points.

(a) (7, 3) (b) (5, 7) (c) (0, 5)

Show solutionHide solution
Worked solution

We know that the abscissa represents the x coordinate in the ordered pair.

For the given points, the abscissa is as follows:

(a) (7, 3) – 7 is the abscissa

(b) (5, 7) – 5 is the abscissa

(c) (0, 5) – 0 is the abscissa
Q42Written answer

Write the y-coordinate (ordinate) of each of the given points.

(a) (3, 5) (b) (4, 0) (c) (2, 7)

Show solutionHide solution
Worked solution

We know that the ordinate represents the y coordinate in the ordered pair.

For the given points, the ordinate is as follows:

(a) (3, 5) – 5 is the ordinate

(b) (4, 0) – 0 is the ordinate

(c) (2, 7) – 7 is the ordinate

Q43Written answer

Plot the given points on a graph sheet and check if the points lie on a straight line. If not, name the shape they form when joined in the given order.

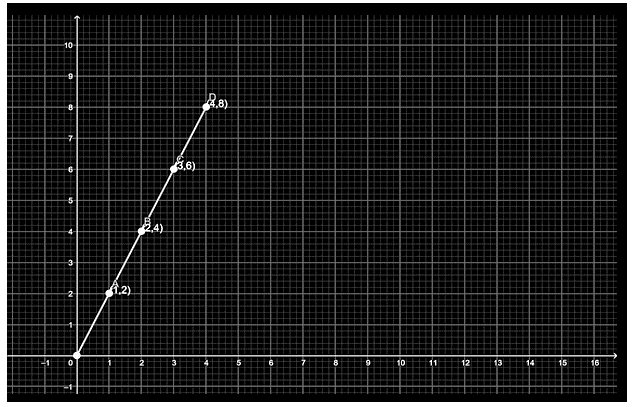
(a) (1, 2), (2, 4), (3, 6), (4, 8).

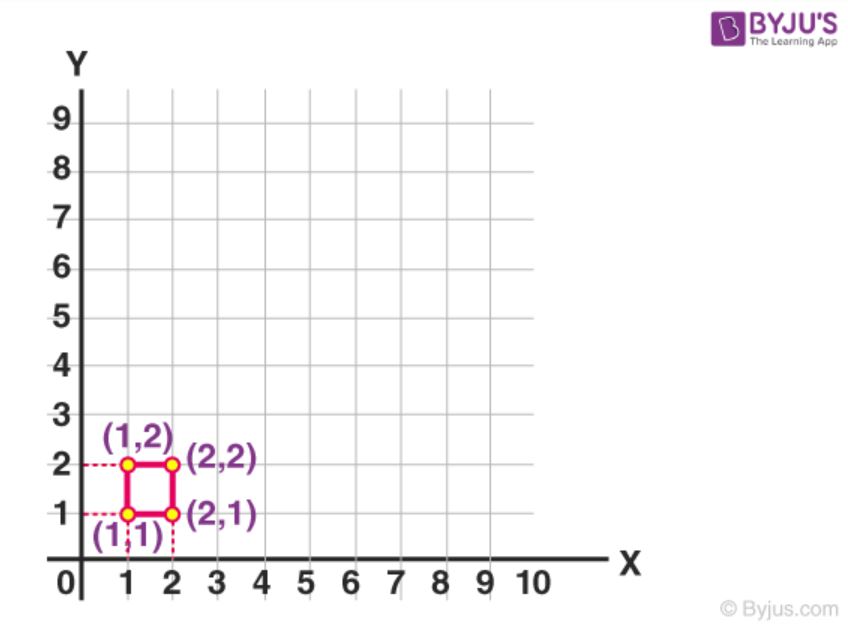
(b) (1, 1), (1, 2), (2, 1), (2, 2).

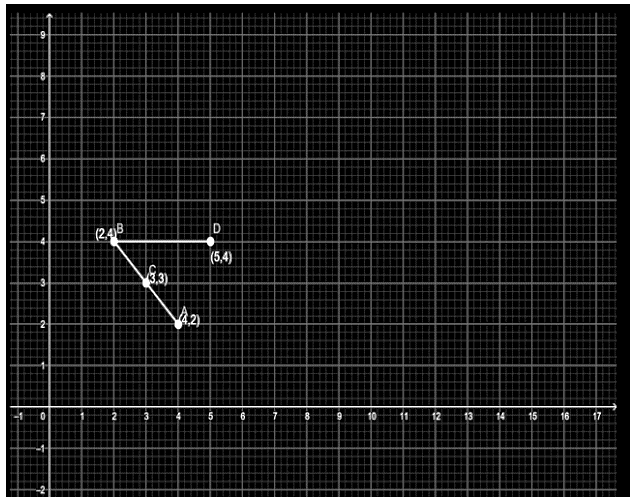
(c) (4, 2), (2, 4), (3, 3), (5, 4).

Show solutionHide solution
Worked solution

(a) For the given points, (1, 2), (2, 4), (3, 6), (4, 8), the obtained graph is given below:

NCERT Exemplar Class 8 Maths Solutions for Chapter 12 - 11

All the points lie on the straight line.

(b) For the given points, (1, 1), (1, 2), (2, 1), (2, 2), the obtained graph is given below:

NCERT Exemplar Class 8 Maths Solutions for Chapter 12 - 12

No, the points do not form a straight line. They form a square.

(c) For the given points, (4, 2), (2, 4), (3, 3), (5, 4), the obtained graph is given below:

NCERT Exemplar Class 8 Maths Solutions for Chapter 12 - 13

The given points do not lie in a straight line. When the points are joined in the given order (also AD), a triangle is formed.

Q44Written answer

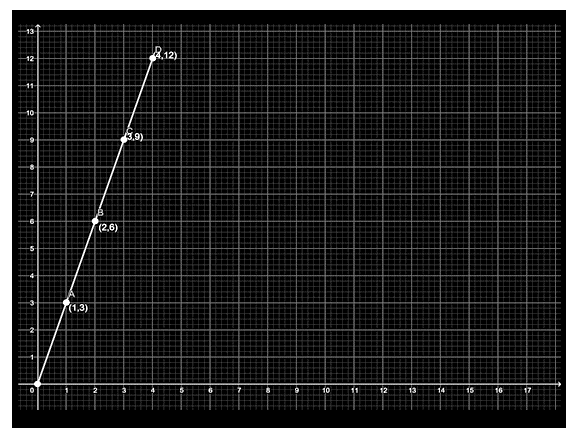
If y–coordinate is 3 times x -coordinate, form a table for it and draw a graph.

Show solutionHide solution
Worked solution

Given that y = 3x

Let x = 1, 2, 3, 4

The corresponding y-coordinate values are given as follows:

When x = 1, y= 3(1) = 3 ⇒ (1, 3)

When x = 2, y= 3(2) = 6 ⇒ (2, 6)

When x = 3, y= 3(3) = 9 ⇒ (3, 9)

When x = 4, y= 3(4) = 12 ⇒ (4, 12)

Hence, the obtained points are:

(1, 3), (2, 6), (3, 9) and (4, 12)

The graph for the above-given points is:

NCERT Exemplar Class 8 Maths Solutions for Chapter 12 - 14

Q45Written answer

Make a line graph for the area of a square as per the given table

Side (in cm) 1 2 3 4
Area (in cm2) 1 4 9 16

Is it a linear graph?

Show solutionHide solution
Worked solution

From the given table, the coordinates are taken as:

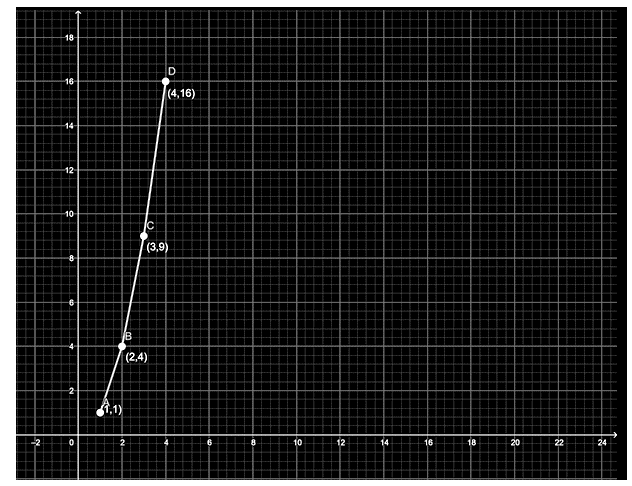
(1, 1), (2, 4), (3, 9), (4, 16)

The graph for the given points are:

NCERT Exemplar Class 8 Maths Solutions for Chapter 12 - 15

Here, the x-axis represents the square side, and the y-axis represents the area of a square.

From the given graph, it is shown that it is not a linear graph because the points are not in the same line (not collinear).

Hence, it is not a linear graph.

Q46Written answer

The cost of a notebook is Rs. 10. Draw a graph after making a table showing the cost of 2, 3, 4 … Notebooks. Use it to find

(a) The cost of 7 notebooks.

(b) The number of notebooks that can be purchased with Rs 50.

Show solutionHide solution
Worked solution

It is given that the cost of one notebook is Rs.10

(a) Hence, the cost of 7 notebooks is 7×10 = 70 rs

(b) To find the number of notebooks that can be purchased for Rs. 50 is

= 50/10

= 5

Hence, the number of notebooks for Rs. 50 is 5.

Q47Written answer

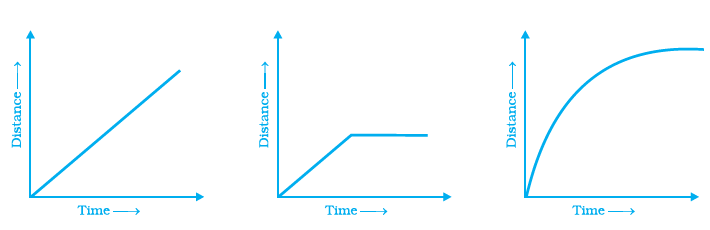
Explain the situations represented by the following distance-time graphs.

NCERT Exemplar Class 8 Maths Solutions for Chapter 12 - 16

Show solutionHide solution
Worked solution

(a) The first figure shows that the distance increases time also increases with equal intervals

(b) The second figure shows that the distance increases as time also increases, and the remaining part shows that the distance is constant for a long time.

(c) The third figure shows that the distance increases times also increases unequal intervals.

Q48Written answer

Complete the given tables and draw a graph for each.

(a)

x 0 1 2 3
Y= 3x+1 1 4 – –

(b)

x 1 2 4 6
Y= x-1 0 – – –
Show solutionHide solution
Worked solution

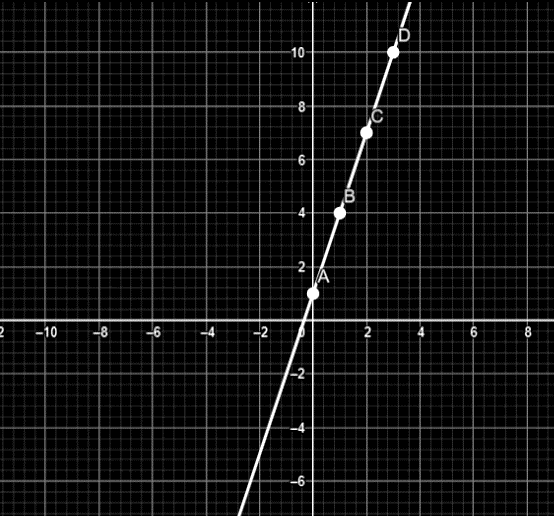
(a) It is given that y = 3x+1

When x= 0, then y = 1

When x=1, then y = 4

Now, we have to find the value of y, when x= 2 and x = 3

When x= 2, y = 3(2) +1 = 7

When x= 3, y = 3(3) +1 = 10

Hence, the obtained coordinate points are:

(0, 1), (1, 4), (2, 7) and (3, 10)

The graph for the given points is:

NCERT Exemplar Class 8 Maths Solutions for Chapter 12 - 17

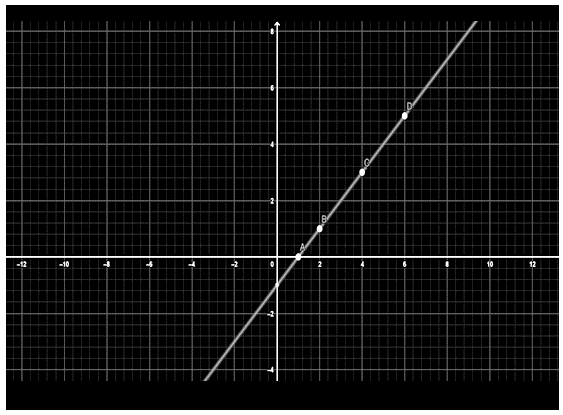
(b) It is given that y= x-1

When x= 1, then y = 0

Now, we have to find the value of y when x= 2, 4, 6,

When x= 2, y = 2 -1 = 1

When x= 4, y = 4- 1 = 3

When x= 6, y = 6- 1 = 5

Hence, the obtained coordinate points are:

(1, 0), (2, 1), (4, 3) and (6, 5)

The graph for the given points is:

NCERT Exemplar Class 8 Maths Solutions for Chapter 12 - 18

Q49Written answer

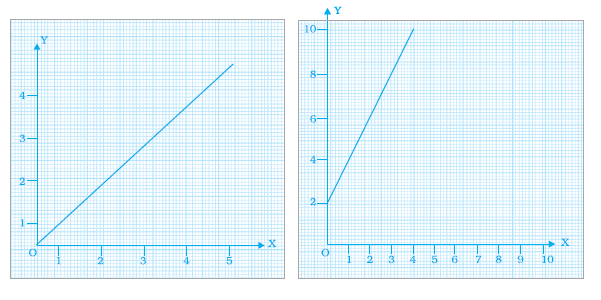
Study the given graphs (a) and (b) and complete the corresponding tables below

NCERT Exemplar Class 8 Maths Solutions for Chapter 12 - 19

(a)

X 0 1 2 3
y

(b)

X 0 1 2 3 4
Y
Show solutionHide solution
Worked solution

(a) From the given graph, the y coordinates of the first table are given as:

Let’s take x = 1, now draw a line parallel to the y-axis at 1, and check whether where it cuts the graph. So we get y=4

Similarly, for other x values, repeat the procedure.

Then, the coordinates are given in the table as follows:

X 0 1 2 3
y 0 1 2 3

(b) From the given graph, the y-coordinates of the first table are given as:

Let’s take x = 1, now draw a line parallel to the y-axis at 1, and check whether where it cuts the graph. So we get y=1

Similarly, for other x values, repeat the procedure.

Then the coordinates are given in the table as follows:

X 0 1 2 3 4
Y 2 4 6 8 10
Q50Written answer

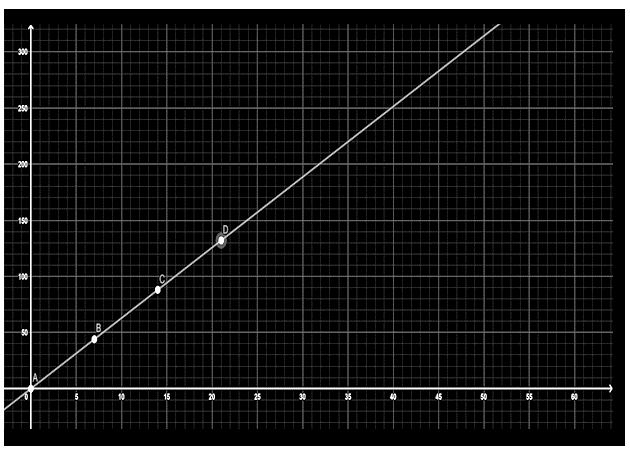
Draw a graph for the radius and circumference of a circle using a suitable scale.

(Hint: Take radius = 7, 14, 21 units and so on)

From the graph,

(a) Find the circumference of the circle when the radius is 42 units.

(b) At what radius will the circumference of the circle be 220 units?

Show solutionHide solution
Worked solution

We know that the circumference of a circle is 2πr. The radius depends on the circumference of a circle.

So, now we have to plot the radius on the x-axis and the circumference on the y-axis. Because the radius is an independent variable and the circumference is a dependent variable.

Now, the equations in terms of x and y are given as:

y = 2πx

When x= 0, then y = 2π (0) = 0

When x= 7, then y = 2π (7) = 44

When x= 14, then y = 2π (14) = 88

When x= 21, then y = 2π (21) = 132

Hence, the coordinates are (0, 0), (7, 44, (14, 88) and (21, 132)

The graph of the points are:

NCERT Exemplar Class 8 Maths Solutions for Chapter 12 - 20

(a) When the radius is 42 units, from the graph, the value of y (circumference) is 264

(b) From the graph, it is obtained that when the circumference is 220, the value of the radius is 35 units.