My Cart
Your Cart 0

    Your cart is empty.

  • Total (Amount) ₹0.00
NCERT · Class 9 · Science

Chapter 7: Motion

Practice each question, then open the answer or worked solution.

Intext Questions – 4

Textbook page 107 · 4 questions
Q1Written answer

What is the nature of the distance-time graphs for uniform and non-uniform motion of an object?

Show solutionHide solution
Worked solution

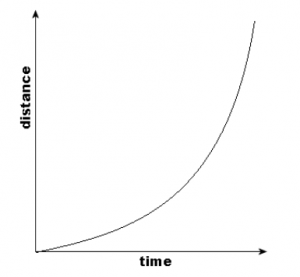
For uniform motion, the distance-time graph is a straight line. On the other hand, the distance-time graph of an object in non-uniform motion is a curve.
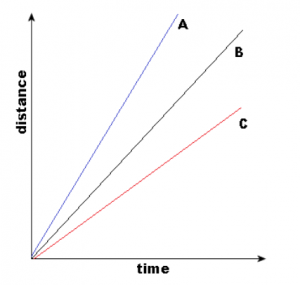
NCERT Solution for Class 9 Science Chapter 8 Question No 1 - 1 solution

NCERT Solution for Class 9 Science Chapter 8 Question No 1 - 2 solution

The first graph describes the uniform motion and the second one describes the non-uniform motion.
Q2Written answer

What can you say about the motion of an object whose distance-time graph is a straight line parallel to the time axis?

Show solutionHide solution
Worked solution

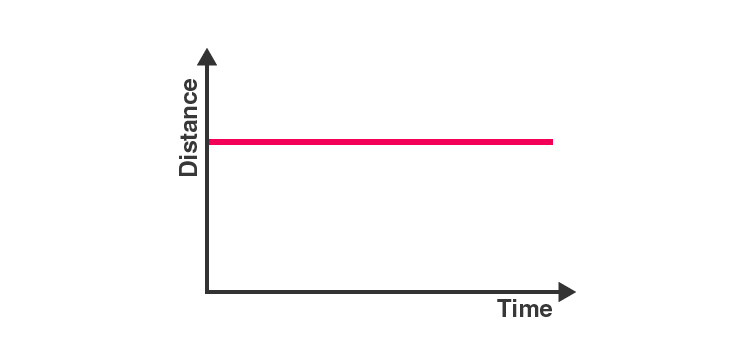
The distance-time graph can be plotted as follows.

NCERT Solution for Class 9 Science Chapter 8 Question No 2 solution

When the slope of the distance-time graph is a straight line parallel to the time axis, the object is at the same position as time passes. That means the object is at rest.

Q3Written answer

What can you say about the motion of an object if its speed-time graph is a straight line parallel to the time axis?

Show solutionHide solution
Worked solution

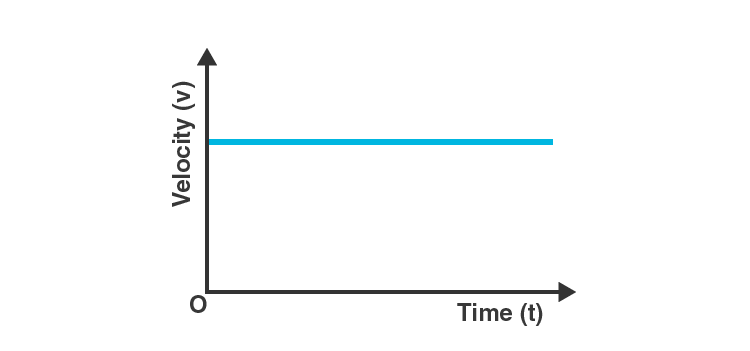
The speed-time graph can be plotted as follows.

NCERT Solution for Class 9 Science Chapter 8 Question No 3 solution

Since there is no change in the velocity of the object (Y-Axis value) at any point of time (X-axis value), the object is said to be in uniform motion.

Q4Written answer

What is the quantity which is measured by the area occupied below the velocity-time graph?

Show solutionHide solution
Worked solution

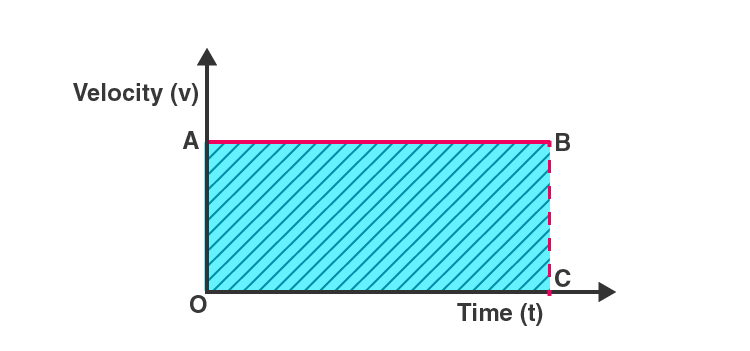
Considering an object in uniform motion, its velocity-time graph can be represented as follows.

NCERT Solution for Class 9 Science Chapter 8 Question No 4 solution

Now, the area below the velocity-time graph is the area of the rectangle OABC, which is given by OA*OC. But OA is the velocity of the object and OC represents time. Therefore, the shaded area can be represented as:

Area under the velocity-time graph = velocity*time.

Substituting the value of velocity as displacement/time in the previous equation, it is found that the area under the velocity-time graph represents the total displacement of the object.