My Cart
Your Cart 0

    Your cart is empty.

  • Total (Amount) ₹0.00
Previous year question hub

Elementary Statistics - Data Interpretation - General Aptitude (GA) Previous Year Questions

Practice Elementary Statistics - Data Interpretation - General Aptitude (GA) previous year questions organised from real papers, with year-wise coverage and clear topic navigation.

11Papers
11Years
18Questions
1Topics

Elementary Statistics question pattern

Every graph below is calculated only from this selection.

Questions by year

Year-wise coverage for Elementary Statistics. Each bar uses a separate theme-derived color.

Difficulty distribution

How the classified questions are distributed by difficulty.

Medium 13 72.2%
Easy 5 27.8%

Question type distribution

MCQ, numerical, multiple-select and other formats found in these papers.

MCQ 16 88.9%
Numerical Answer Type (NAT) 2 11.1%

Subject weightage

Top subjects by unique question coverage.

General Aptitude (GA)
18 Qs

Most asked topics

Top topics across the included previous year papers.

Data Interpretation
18 Qs

Subtopic coverage

Top subtopics inside this exact selection.

Elementary Statistics
18 Qs

Paper coverage

Question coverage for the most populated papers. Every active PYP paper remains listed below.

Textile Engineering & Fibre Science (TF) 2025
1 Qs
Textile Engineering & Fibre Science (TF) 2024
2 Qs
Textile Engineering & Fibre Science (TF) 2021
1 Qs
Textile Engineering & Fibre Science (TF) 2020
1 Qs
Textile Engineering & Fibre Science (TF) 2019
1 Qs
Textile Engineering & Fibre Science (TF) 2018
2 Qs
Textile Engineering & Fibre Science (TF) 2017
2 Qs
Textile Engineering & Fibre Science (TF) 2016
1 Qs
Textile Engineering & Fibre Science (TF) 2015
3 Qs
Textile Engineering & Fibre Science (TF) 2014
1 Qs
Textile Engineering & Fibre Science (TF) 2012
3 Qs

Included previous year papers

Newest papers appear first. Sort by year, question coverage or name.

PaperYear / sessionQuestions in this viewOpen
Textile Engineering & Fibre Science (TF) 202520251View paper
Textile Engineering & Fibre Science (TF) 202420242View paper
Textile Engineering & Fibre Science (TF) 202120211View paper
Textile Engineering & Fibre Science (TF) 202020201View paper
Textile Engineering & Fibre Science (TF) 201920191View paper
Textile Engineering & Fibre Science (TF) 201820182View paper
Textile Engineering & Fibre Science (TF) 201720172View paper
Textile Engineering & Fibre Science (TF) 201620161View paper
Textile Engineering & Fibre Science (TF) 201520153View paper
Textile Engineering & Fibre Science (TF) 201420141View paper
Textile Engineering & Fibre Science (TF) 201220123View paper

All Elementary Statistics previous year questions

Practice every matching question in batches of 20, with every available option.

1
2012 · General Aptitude (GA) · Data Interpretation · Elementary Statistics
Textile Engineering & Fibre Science (TF) 2012
Yarns Y₁ and Y₂ have the same strength when tested at 200 mm gauge length. If mass unevenness CV (%) of yarns Y₁ and Y₂ are 10 and 20 respectively, the ratio of the strength of yarns Y₁ and Y₂ when tested at 500 mm gauge length is
Open complete paper
2
2012 · General Aptitude (GA) · Data Interpretation · Elementary Statistics
Textile Engineering & Fibre Science (TF) 2012
The mass CV (%) of the final sliver is approximately
Open complete paper
3
2012 · General Aptitude (GA) · Data Interpretation · Elementary Statistics
Textile Engineering & Fibre Science (TF) 2012
The thickness of the above fabric (mm) is approximately
Open complete paper
4
2014 · General Aptitude (GA) · Data Interpretation · Elementary Statistics
Textile Engineering & Fibre Science (TF) 2014
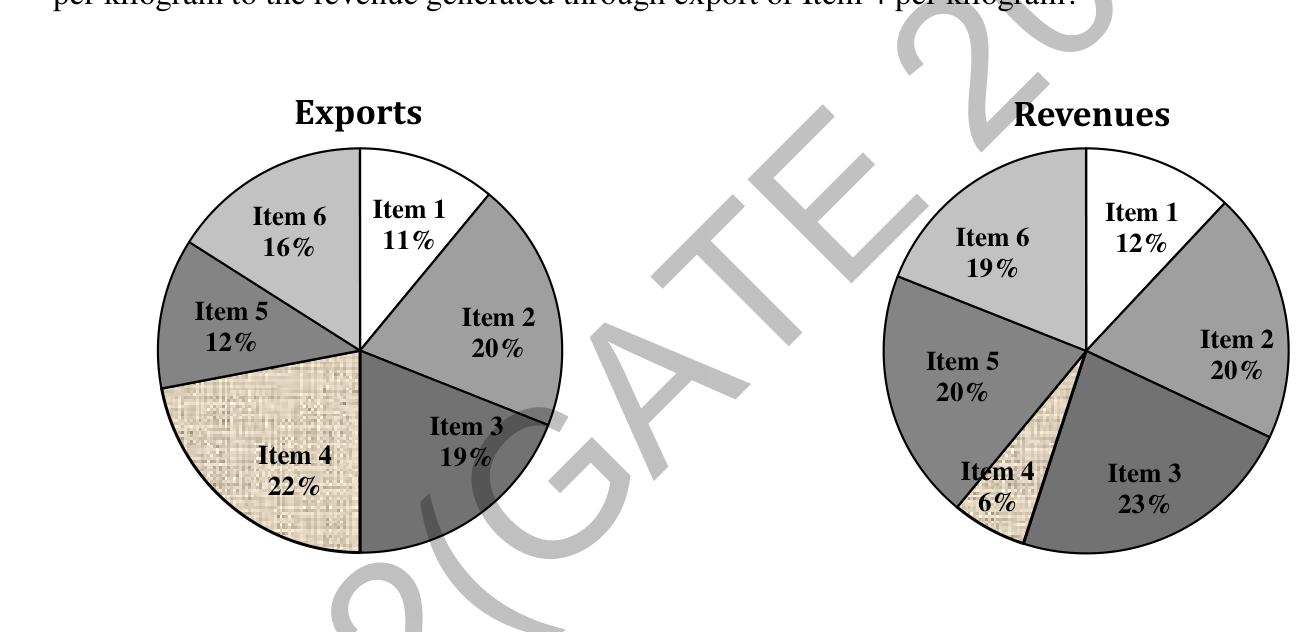
The total exports and revenues from the exports of a country are given in the two pie charts below. The pie chart for exports shows the quantity of each item as a percentage of the total quantity of exports. The pie chart for the revenues shows the percentage of the total revenue generated through export of each item. The total quantity of exports of all the items is 5 lakh tonnes and the total revenues are 250 crore rupees. What is the ratio of the revenue generated through export of Item 1 per kilogram to the revenue generated through export of Item 4 per kilogram?

Source question diagram

Open complete paper
5
2015 · General Aptitude (GA) · Data Interpretation · Elementary Statistics
Textile Engineering & Fibre Science (TF) 2015
Options:

If [Cs] and [Cp] represent dye concentration in the bath and in the fibre, respectively, the isotherm for dyeing of polyester with disperse dyes is represented by the figure

Open complete paper
6
2015 · General Aptitude (GA) · Data Interpretation · Elementary Statistics
Textile Engineering & Fibre Science (TF) 2015
If [Cs] and [Cf] represent dye concentration in the bath and in the fibre, respectively, the isotherm for dyeing of polyester with disperse dyes is represented by the figure
Open complete paper
7
2015 · General Aptitude (GA) · Data Interpretation · Elementary Statistics
Textile Engineering & Fibre Science (TF) 2015
The correlation coefficient (r) between two variables is 0.9. The unexplained variation (%) is __________
Open complete paper
8
2016 · General Aptitude (GA) · Data Interpretation · Elementary Statistics
Textile Engineering & Fibre Science (TF) 2016
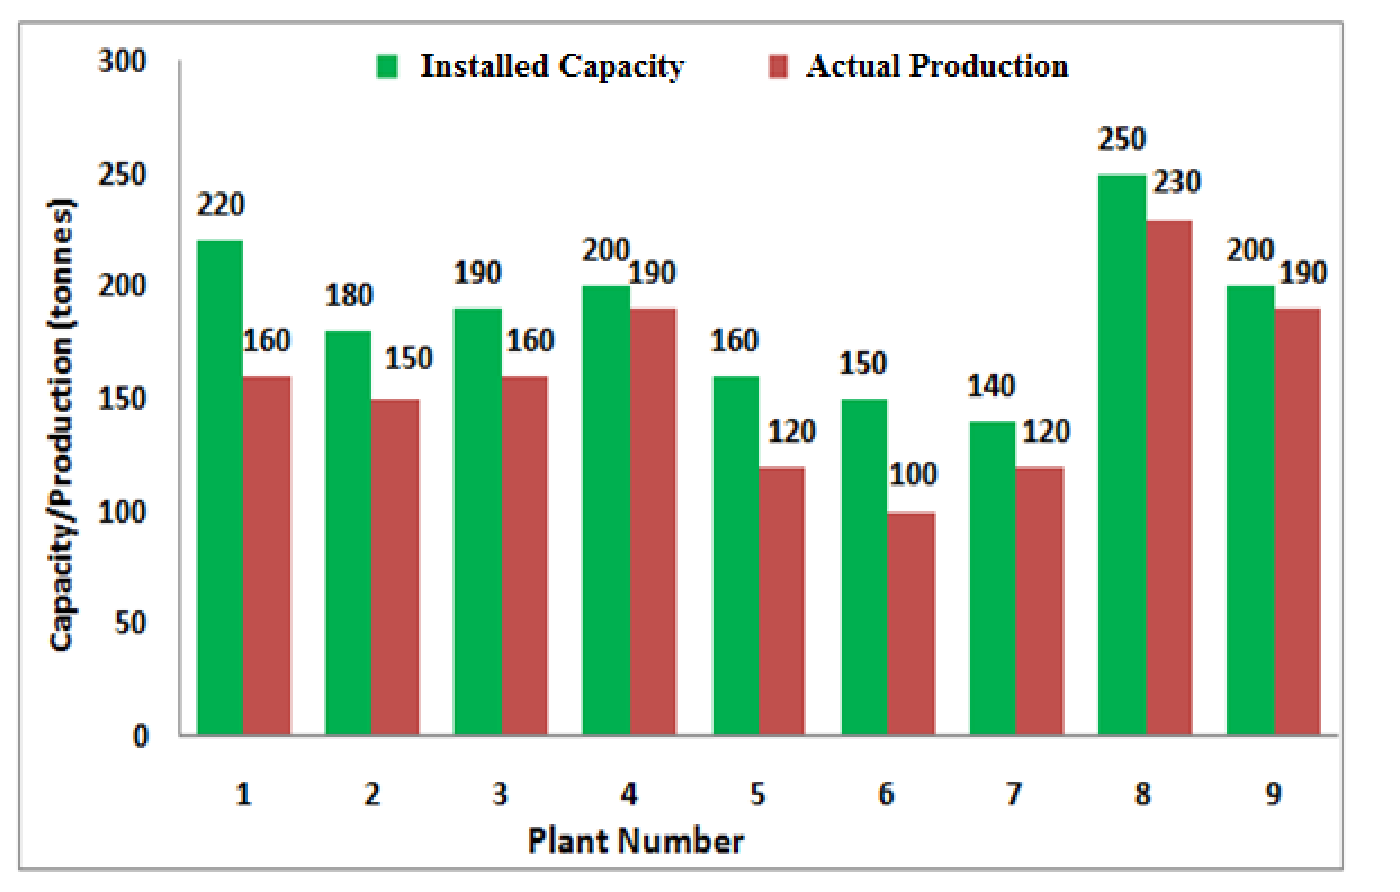
The following graph represents the installed capacity for cement production (in tonnes) and the actual production (in tonnes) of nine cement plants of a cement company. Capacity utilization of a plant is defined as ratio of actual production of cement to installed capacity. A plant with installed capacity of at least 200 tonnes is called a large plant and a plant with lesser capacity is called a small plant. The difference between total production of large plants and small plants, in tonnes is ______.

Source question diagram

Open complete paper
9
2017 · General Aptitude (GA) · Data Interpretation · Elementary Statistics
Textile Engineering & Fibre Science (TF) 2017
In a company with 100 employees, 45 earn Rs. 20,000 per month, 25 earn Rs. 30,000, 20 earn Rs. 40,000, 8 earn Rs. 60,000, and 2 earn Rs. 150,000. The median of the salaries is
Open complete paper
10
2017 · General Aptitude (GA) · Data Interpretation · Elementary Statistics
Textile Engineering & Fibre Science (TF) 2017
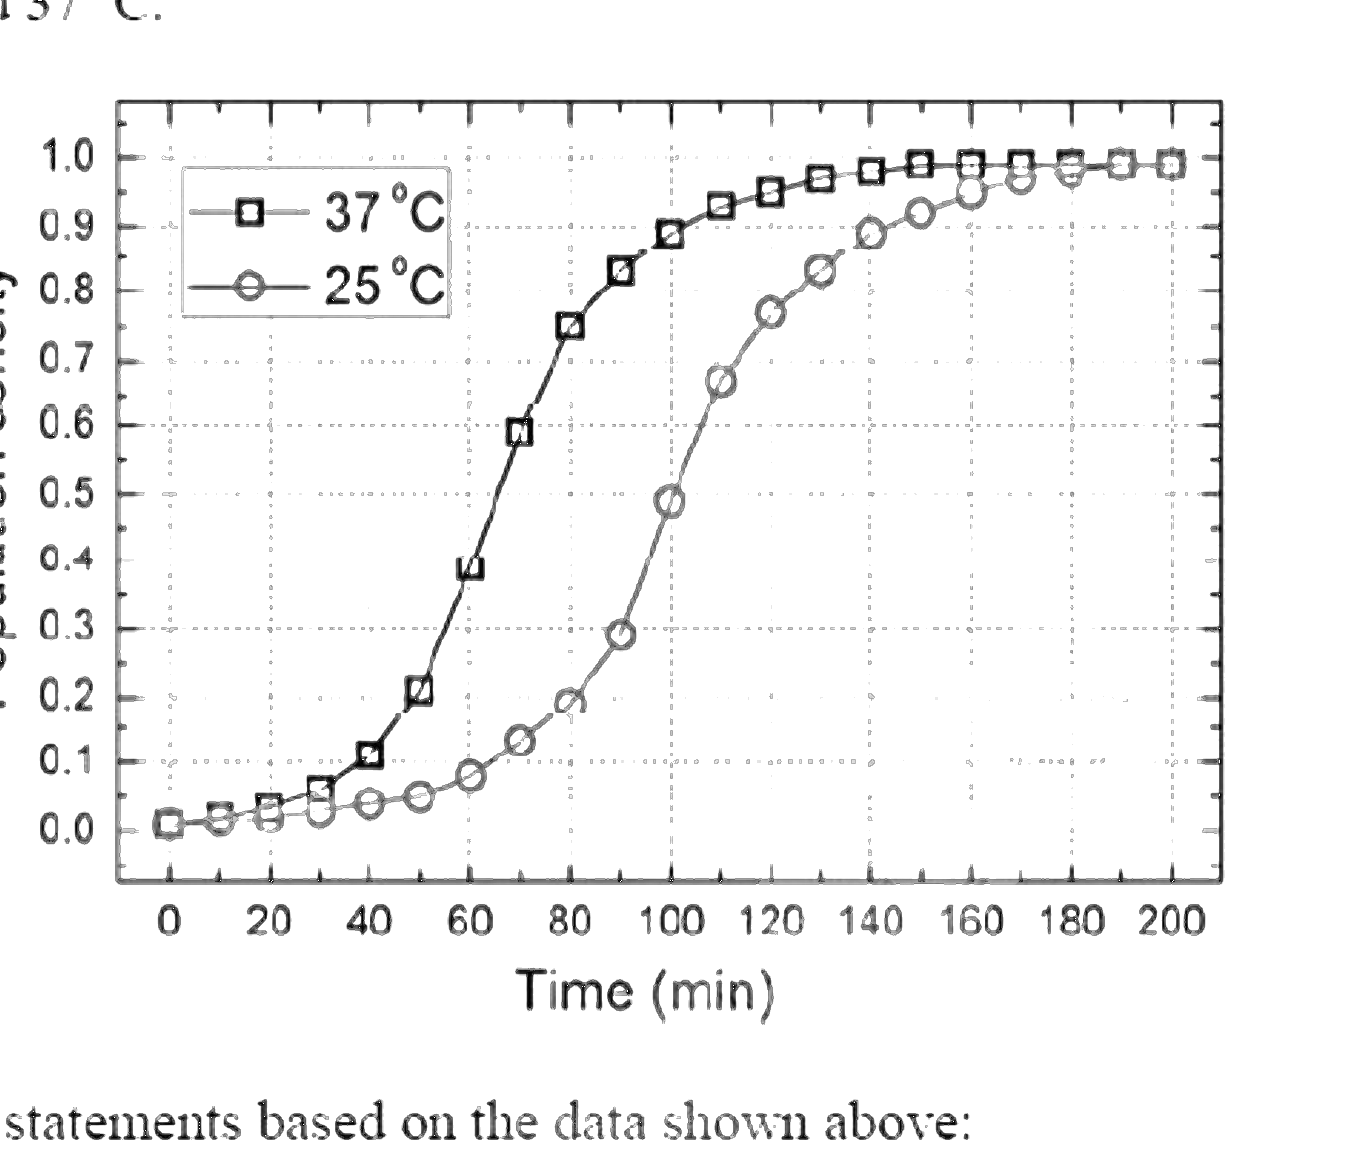
The growth of bacteria (lactobacillus) in milk leads to curd formation. A minimum bacterial population density of 0.8 (in suitable units) is needed to form curd. In the graph below, the population density of lactobacillus in 1 litre of milk is plotted as a function of time, at two different temperatures, 25 °C and 37 °C.
Consider the following statements based on the data shown above:
i. The growth in bacterial population stops earlier at 37 °C as compared to 25 °C
ii. The time taken for curd formation at 25 °C is twice the time taken at 37 °C
Which one of the following options is correct?
Open complete paper
11
2018 · General Aptitude (GA) · Data Interpretation · Elementary Statistics
Textile Engineering & Fibre Science (TF) 2018
To pass a test, a candidate needs to answer at least 2 out of 3 questions correctly. A total of 6,30,000 candidates appeared for the test. Question A was answered correctly by 3,30,000 candidates. Question B was answered correctly by 2,50,000 candidates. Question C was answered correctly by 2,60,000 candidates. Both questions A and B were answered correctly by 1,00,000 candidates. Both questions B and C were answered correctly by 90,000 candidates. Both questions A and C were answered correctly by 80,000 candidates. If the number of students answering all questions correctly is the same as the number answering none, how many candidates failed to clear the test?
Open complete paper
12
2018 · General Aptitude (GA) · Data Interpretation · Elementary Statistics
Textile Engineering & Fibre Science (TF) 2018

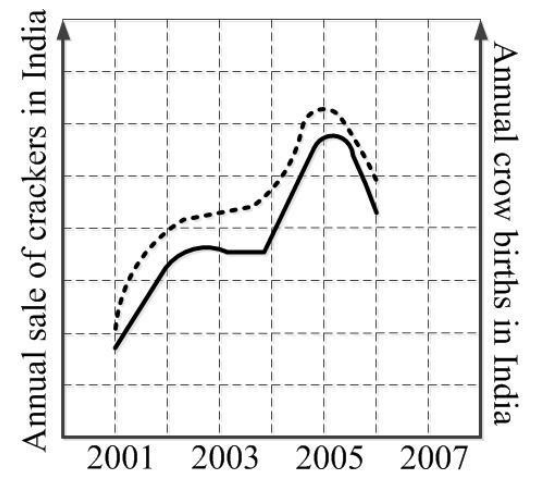
In a detailed study of annual crow births in India, it was found that there was relatively no growth during the period 2002 to 2004 and a sudden spike from 2004 to 2005. In another unrelated study, it was found that the revenue from cracker sales in India which remained fairly flat from 2002 to 2004, saw a sudden spike in 2005 before declining again in 2006. The solid line in the graph below refers to annual sale of crackers and the dashed line refers to the annual crow births in India. Choose the most appropriate inference from the above data.

Source question diagram

Open complete paper
13
2019 · General Aptitude (GA) · Data Interpretation · Elementary Statistics
Textile Engineering & Fibre Science (TF) 2019
Mola is a digital platform for taxis in a city. It offers three types of rides – Pool, Mini and Prime. The Table below presents the number of rides for the past four months. The platform earns one US dollar per ride. What is the percentage share of revenue contributed by Prime to the total revenues of Mola, for the entire duration?

Question diagram

Open complete paper
14
2020 · General Aptitude (GA) · Data Interpretation · Elementary Statistics
Textile Engineering & Fibre Science (TF) 2020
Two yarns have variance of strength as \( V_1 \) and \( V_2 \). If \( V_1 < V_2 \), the variance ratio “\( F \)” would be
Open complete paper
15
2021 · General Aptitude (GA) · Data Interpretation · Elementary Statistics
Textile Engineering & Fibre Science (TF) 2021
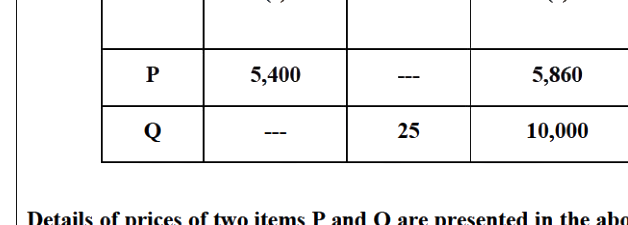
Details of prices of two items P and Q are presented in the above table. The ratio of cost of item P to cost of item Q is 3:4. Discount is calculated as the difference between the marked price and the selling price. The profit percentage is calculated as the ratio of the difference between selling price and cost, to the cost (Profit % = \(\frac{\text{selling price} - \text{cost}}{\text{cost}} \times 100\)). The discount on item Q, as a percentage of its marked price, is ______

Question diagram

Open complete paper
16
2024 · General Aptitude (GA) · Data Interpretation · Elementary Statistics
Textile Engineering & Fibre Science (TF) 2024
Consider the following sample of numbers: 9, 18, 11, 14, 15, 17, 10, 69, 11, 13 The median of the sample is
Open complete paper
17
2024 · General Aptitude (GA) · Data Interpretation · Elementary Statistics
Textile Engineering & Fibre Science (TF) 2024
The pie chart presents the percentage contribution of different macronutrients to a typical 2,000 kcal diet of a person.

The typical energy density (kcal/g) of these macronutrients is given in the table.

MacronutrientEnergy density (kcal/g)
Carbohydrates4
Proteins4
Unsaturated fat9
Saturated fat9
Trans fat9

The total fat (all three types), in grams, this person consumes is
Open complete paper
18
2025 · General Aptitude (GA) · Data Interpretation · Elementary Statistics
Textile Engineering & Fibre Science (TF) 2025
Which one of the following options is correct for the given data in the table?
Open complete paper