Difficulty distribution
How the classified questions are distributed by difficulty.
Your cart is empty.
Practice Rock and Fluid Properties - Reservoir Engineering - Petroleum Engineering previous year questions organised from real papers, with year-wise coverage and clear topic navigation.
Every graph below is calculated only from this selection.
Year-wise coverage for Rock and Fluid Properties. Each bar uses a separate theme-derived color.
How the classified questions are distributed by difficulty.
MCQ, numerical, multiple-select and other formats found in these papers.
Top subjects by unique question coverage.
Top topics across the included previous year papers.
Top subtopics inside this exact selection.
Question coverage for the most populated papers. Every active PYP paper remains listed below.
Newest papers appear first. Sort by year, question coverage or name.
| Paper | Year / session | Questions in this view | Open |
|---|---|---|---|
| Petroleum Engineering (PE) 2026 | 2026 | 3 | View paper |
| Petroleum Engineering (PE) 2025 | 2025 | 8 | View paper |
| Petroleum Engineering (PE) 2024 | 2024 | 10 | View paper |
| Petroleum Engineering (PE) 2023 | 2023 | 7 | View paper |
| Petroleum Engineering (PE) 2022 | 2022 | 8 | View paper |
| Petroleum Engineering (PE) 2021 | 2021 | 5 | View paper |
| Petroleum Engineering (PE) 2020 | 2020 | 10 | View paper |
| Petroleum Engineering (PE) 2018 | 2018 | 6 | View paper |
| Petroleum Engineering (PE) 2017 | 2017 | 5 | View paper |
| Petroleum Engineering (PE) 2016 | 2016 | 5 | View paper |
Practice every matching question in batches of 20, with every available option.
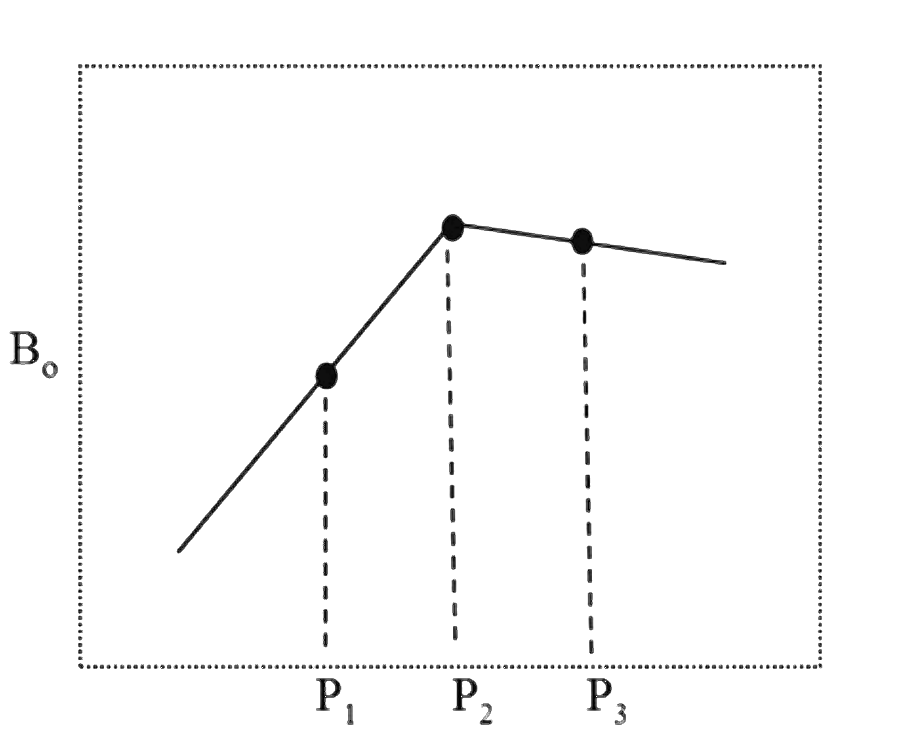
A Differential Liberation Experiment (DLE) and a Constant Composition Expansion (CCE)/Flash liberation experiment were performed in a laboratory for a crude oil to find the formation volume factor (Bo) and the dissolved gas oil ratio (Rs). The pressure stages for both experiments were kept the same. At a pressure less than the bubble point pressure of the crude oil, which of the following statements is TRUE?

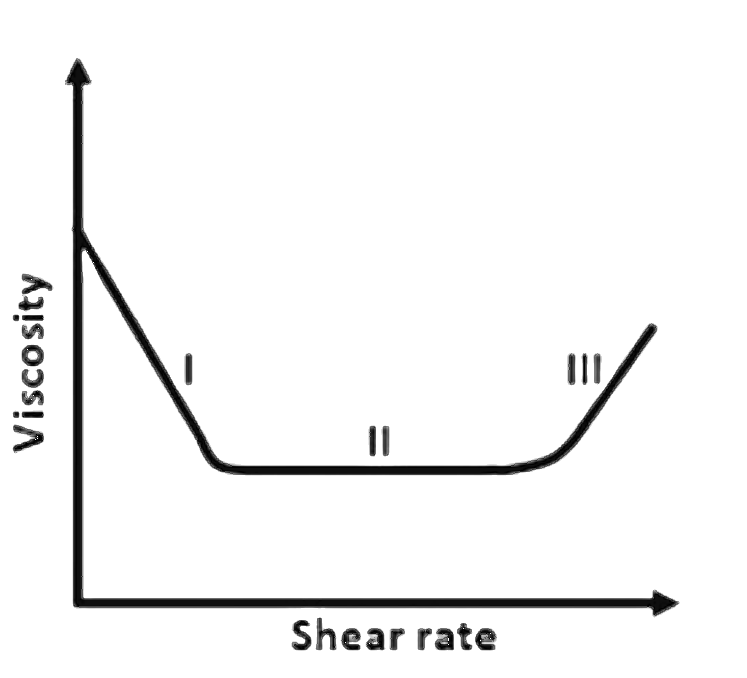
The viscosity - shear rate curve for a fluid is shown in the following plot. Which one of the following options best describes the behavior of the fluid in the regions I, II, and III, respectively?


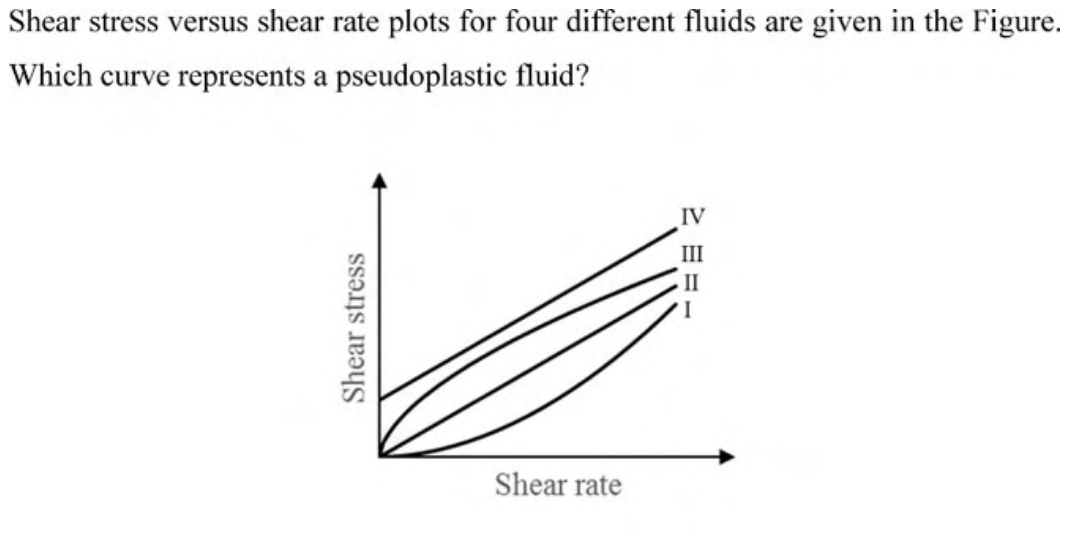
Shear stress versus shear rate plots for four different fluids are given in the Figure. Which curve represents a pseudoplastic fluid?


Showing 20 of 67 questions