Difficulty distribution
How the classified questions are distributed by difficulty.
Your cart is empty.
Practice Probability and Statistics - Engineering Mathematics - Petroleum Engineering previous year questions organised from real papers, with year-wise coverage and clear topic navigation.
Every graph below is calculated only from this selection.
Year-wise coverage for Probability and Statistics. Each bar uses a separate theme-derived color.
How the classified questions are distributed by difficulty.
MCQ, numerical, multiple-select and other formats found in these papers.
Top subjects by unique question coverage.
Top topics across the included previous year papers.
Top subtopics inside this exact selection.
Question coverage for the most populated papers. Every active PYP paper remains listed below.
Newest papers appear first. Sort by year, question coverage or name.
| Paper | Year / session | Questions in this view | Open |
|---|---|---|---|
| Petroleum Engineering (PE) 2026 | 2026 | 2 | View paper |
| Petroleum Engineering (PE) 2025 | 2025 | 1 | View paper |
| Petroleum Engineering (PE) 2024 | 2024 | 1 | View paper |
| Petroleum Engineering (PE) 2023 | 2023 | 1 | View paper |
| Petroleum Engineering (PE) 2022 | 2022 | 1 | View paper |
| Petroleum Engineering (PE) 2021 | 2021 | 4 | View paper |
| Petroleum Engineering (PE) 2020 | 2020 | 4 | View paper |
| Petroleum Engineering (PE) 2019 | 2019 | 9 | View paper |
| Petroleum Engineering (PE) 2018 | 2018 | 2 | View paper |
| Petroleum Engineering (PE) 2017 | 2017 | 2 | View paper |
| Petroleum Engineering (PE) 2016 | 2016 | 1 | View paper |
Practice every matching question in batches of 20, with every available option.
| Set | (n, p) |
|---|---|
| I | (60, 0.3) |
| II | (60, 0.2) |
| III | (24, 0.5) |
Match the crystal structure in Column A with the corresponding packing fractions in Column B of the table
| Column A | Column B |
|---|---|
| 1 Simple cubic | P 0.74 |
| 2 Hexagonal close-packed | Q 0.68 |
| 3 Body-centered cubic | R 0.52 |
| 4 Face-centered cubic |
The average proportion non-conforming of 20 samples each of size 100 items is 0.12. The upper control limit for the relevant chart is _____ (round off to 2 decimal places)
A warehouse has 1 loading dock and 3 persons for loading operations. The arrival rate of trucks follows Poisson distribution with a mean of 4 trucks/hour. The average loading time (by three persons together) per truck is exponentially distributed with a mean of 10 minutes. The charge of the trucks per hour and loading charges per person per hour are Rs.20 and Rs.6, respectively. The total cost (in Rs./hour) is _____
The mean time to repair (MTTR) for a repairable system is 30 minutes. When maintenance time changes from 20 minutes to 40 minutes, the net increase in maintainability is closest to
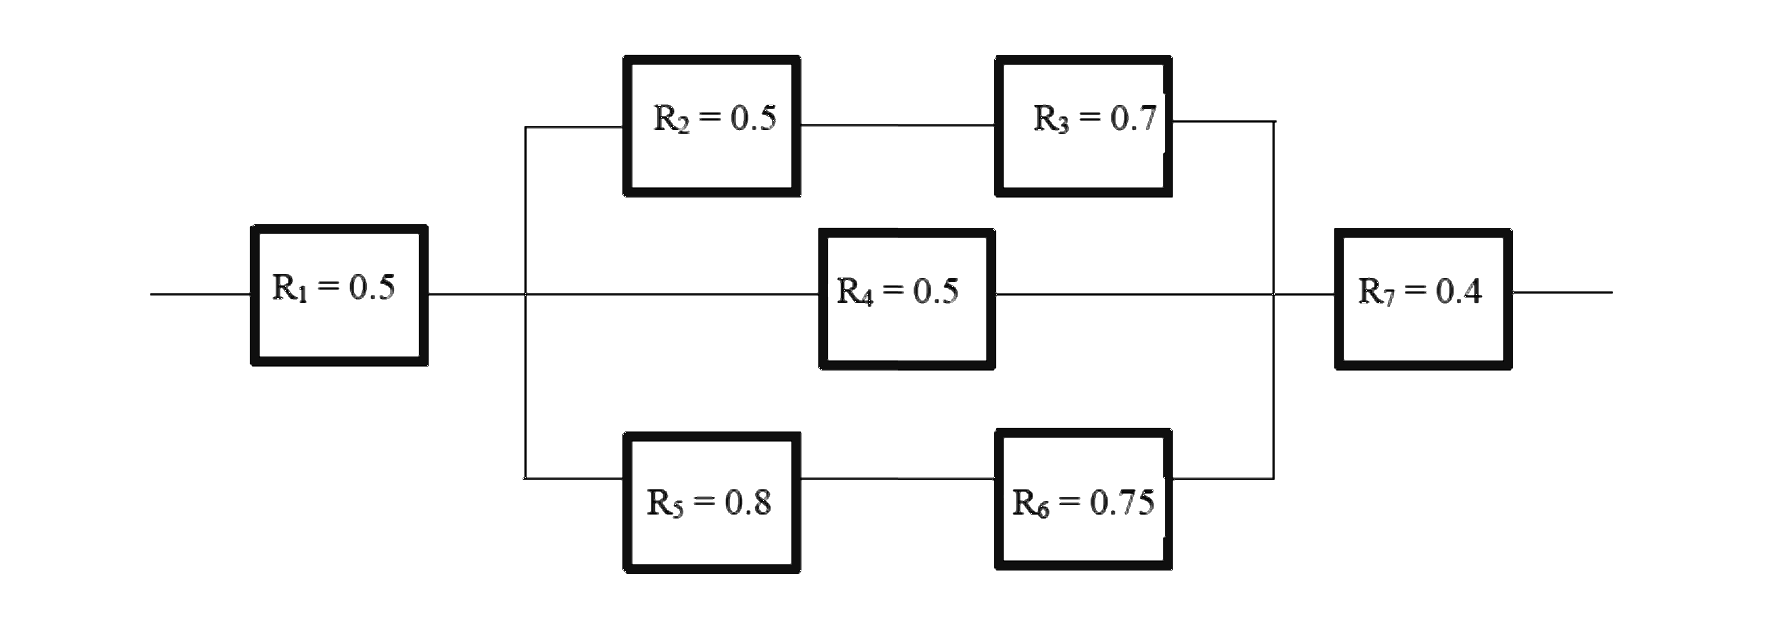
A monitoring system has seven components. The reliability of each component is shown in the figure. The system reliability is _____ (round off to 2 decimal places)

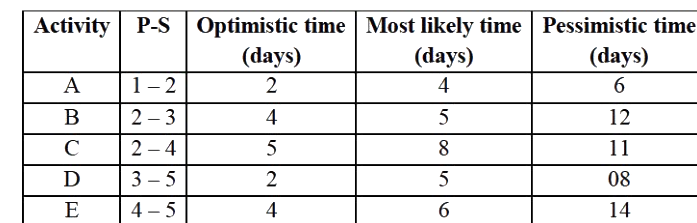
| Activity | P-S | Optimistic time (days) | Most likely time (days) | Pessimistic time (days) |
|---|---|---|---|---|
| A | 1 – 2 | 2 | 4 | 6 |
| B | 2 – 3 | 4 | 5 | 12 |
| C | 2 – 4 | 5 | 8 | 11 |
| D | 3 – 5 | 2 | 5 | 08 |
| E | 4 – 5 | 4 | 6 | 14 |

Showing 20 of 28 questions