My Cart
Your Cart 0

    Your cart is empty.

  • Total (Amount) ₹0.00
Previous year question hub

Data Interpretation - General Aptitude (GA) Previous Year Questions

Practice Data Interpretation - General Aptitude (GA) previous year questions organised from real papers, with year-wise coverage and clear topic navigation.

9Papers
9Years
13Questions
1Topics

Data Interpretation question pattern

Every graph below is calculated only from this selection.

Questions by year

Compare question counts across years.

Difficulty distribution

How the classified questions are distributed by difficulty.

Medium 9 69.2%
Easy 4 30.8%

Question type distribution

MCQ, numerical, multiple-select and other formats found in these papers.

MCQ 11 84.6%
Numerical Answer Type (NAT) 2 15.4%

Subject weightage

Top subjects by unique question coverage.

General Aptitude (GA)
13 Qs

Most asked topics

Top topics across the included previous year papers.

Data Interpretation
13 Qs

Subtopic coverage

Top subtopics inside this exact selection.

Elementary Statistics
13 Qs

Paper coverage

Question coverage for the most populated papers. Every active PYP paper remains listed below.

Textile Engineering & Fibre Science (TF) 2025
1 Qs
Textile Engineering & Fibre Science (TF) 2024
2 Qs
Textile Engineering & Fibre Science (TF) 2019
1 Qs
Textile Engineering & Fibre Science (TF) 2018
1 Qs
Textile Engineering & Fibre Science (TF) 2017
2 Qs
Textile Engineering & Fibre Science (TF) 2016
1 Qs
Textile Engineering & Fibre Science (TF) 2015
1 Qs
Textile Engineering & Fibre Science (TF) 2014
1 Qs
Textile Engineering & Fibre Science (TF) 2012
3 Qs

Browse by subtopics

Open a focused page built from the same verified paper data.

Included previous year papers

Newest papers appear first. Search these papers or sort by year and name.

Paper nameYearPDFAttempt
Textile Engineering & Fibre Science (TF) 20252025
1 questions in this view
2025
Textile Engineering & Fibre Science (TF) 20242024
2 questions in this view
2024
Textile Engineering & Fibre Science (TF) 20192019
1 questions in this view
2019
Textile Engineering & Fibre Science (TF) 20182018
1 questions in this view
2018
Textile Engineering & Fibre Science (TF) 20172017
2 questions in this view
2017
Textile Engineering & Fibre Science (TF) 20162016
1 questions in this view
2016
Textile Engineering & Fibre Science (TF) 20152015
1 questions in this view
2015
Textile Engineering & Fibre Science (TF) 20142014
1 questions in this view
2014
Textile Engineering & Fibre Science (TF) 20122012
3 questions in this view
2012

Sample previous year questions

A varied preview from the papers represented in this selection, with every available option.

1
2012 · General Aptitude (GA) · Data Interpretation · Elementary Statistics
Textile Engineering & Fibre Science (TF) 2012
Yarns Y₁ and Y₂ have the same strength when tested at 200 mm gauge length. If mass unevenness CV (%) of yarns Y₁ and Y₂ are 10 and 20 respectively, the ratio of the strength of yarns Y₁ and Y₂ when tested at 500 mm gauge length is
Open complete paper
2
2014 · General Aptitude (GA) · Data Interpretation · Elementary Statistics
Textile Engineering & Fibre Science (TF) 2014
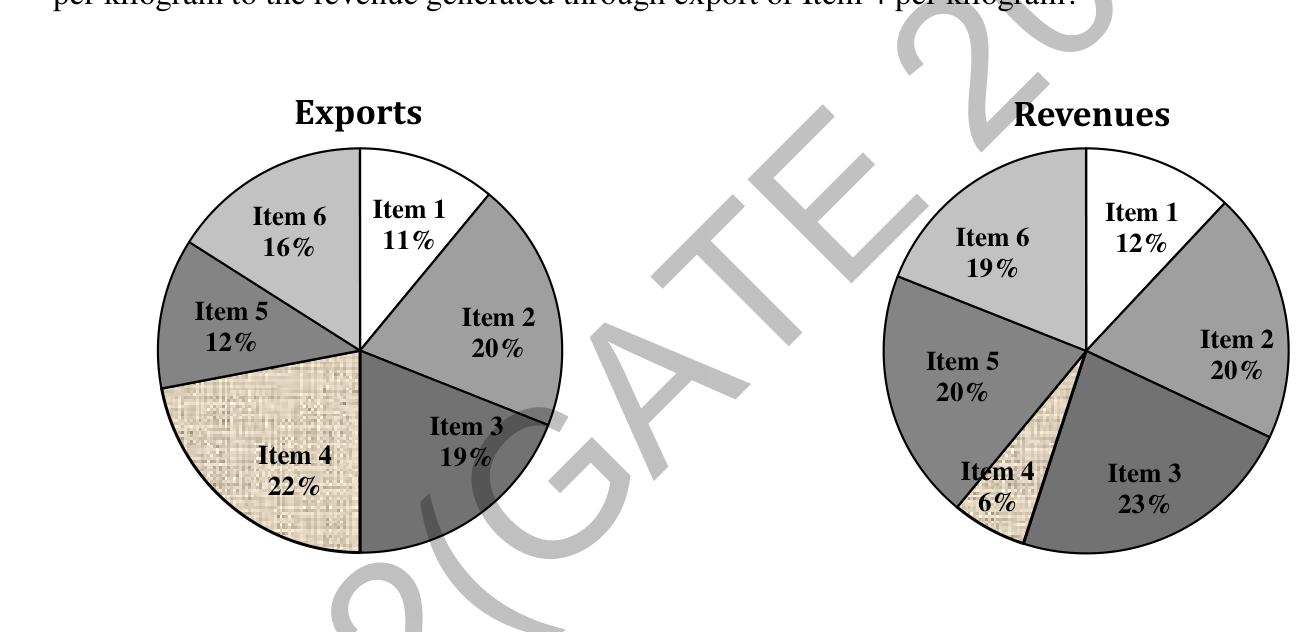
The total exports and revenues from the exports of a country are given in the two pie charts below. The pie chart for exports shows the quantity of each item as a percentage of the total quantity of exports. The pie chart for the revenues shows the percentage of the total revenue generated through export of each item. The total quantity of exports of all the items is 5 lakh tonnes and the total revenues are 250 crore rupees. What is the ratio of the revenue generated through export of Item 1 per kilogram to the revenue generated through export of Item 4 per kilogram?

Source question diagram

Open complete paper
3
2015 · General Aptitude (GA) · Data Interpretation · Elementary Statistics
Textile Engineering & Fibre Science (TF) 2015
The correlation coefficient (r) between two variables is 0.9. The unexplained variation (%) is __________
Open complete paper
4
2016 · General Aptitude (GA) · Data Interpretation · Elementary Statistics
Textile Engineering & Fibre Science (TF) 2016
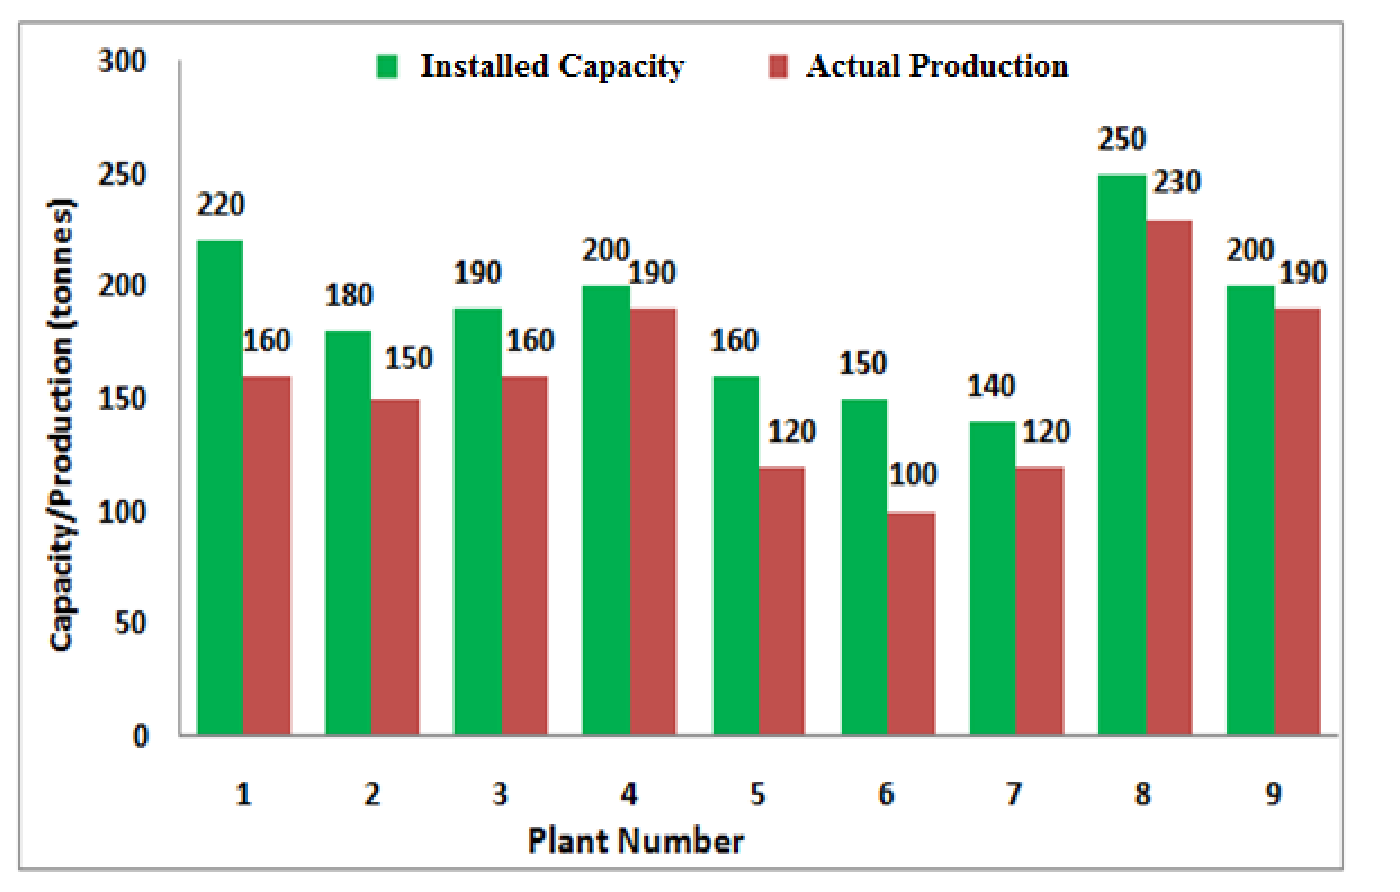
The following graph represents the installed capacity for cement production (in tonnes) and the actual production (in tonnes) of nine cement plants of a cement company. Capacity utilization of a plant is defined as ratio of actual production of cement to installed capacity. A plant with installed capacity of at least 200 tonnes is called a large plant and a plant with lesser capacity is called a small plant. The difference between total production of large plants and small plants, in tonnes is ______.

Source question diagram

Open complete paper
5
2017 · General Aptitude (GA) · Data Interpretation · Elementary Statistics
Textile Engineering & Fibre Science (TF) 2017
In a company with 100 employees, 45 earn Rs. 20,000 per month, 25 earn Rs. 30,000, 20 earn Rs. 40,000, 8 earn Rs. 60,000, and 2 earn Rs. 150,000. The median of the salaries is
Open complete paper
6
2018 · General Aptitude (GA) · Data Interpretation · Elementary Statistics
Textile Engineering & Fibre Science (TF) 2018

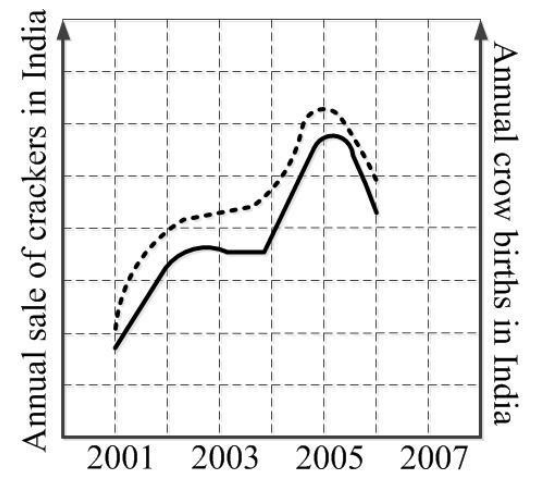
In a detailed study of annual crow births in India, it was found that there was relatively no growth during the period 2002 to 2004 and a sudden spike from 2004 to 2005. In another unrelated study, it was found that the revenue from cracker sales in India which remained fairly flat from 2002 to 2004, saw a sudden spike in 2005 before declining again in 2006. The solid line in the graph below refers to annual sale of crackers and the dashed line refers to the annual crow births in India. Choose the most appropriate inference from the above data.

Source question diagram

Open complete paper