My Cart
Your Cart 0

    Your cart is empty.

  • Total (Amount) ₹0.00
Previous year question hub

Data Interpretation - General Aptitude - General Aptitude (GA) Previous Year Questions

Practice Data Interpretation - General Aptitude - General Aptitude (GA) previous year questions organised from real papers, with year-wise coverage and clear topic navigation.

3Papers
1Years
6Questions
1Topics

Data Interpretation question pattern

Every graph below is calculated only from this selection.

Questions by year

Compare question counts across years.

Difficulty distribution

How the classified questions are distributed by difficulty.

Medium 4 66.7%
Hard 2 33.3%

Question type distribution

MCQ, numerical, multiple-select and other formats found in these papers.

MCQ 4 66.7%
Numerical Answer Type (NAT) 2 33.3%

Subject weightage

Top subjects by unique question coverage.

General Aptitude (GA)
6 Qs

Most asked topics

Top topics across the included previous year papers.

General Aptitude
6 Qs

Subtopic coverage

Top subtopics inside this exact selection.

Data Interpretation
6 Qs

Paper coverage

Question coverage for the most populated papers. Every active PYP paper remains listed below.

Electronics & Communication Engineering (EC) 2015 [Session 1]
3 Qs
Electronics & Communication Engineering (EC) 2015 [Session 3]
2 Qs
Electronics & Communication Engineering (EC) 2015 [Session 2]
1 Qs

Included previous year papers

Newest papers appear first. Search these papers or sort by year and name.

Paper nameYearPDFAttempt
Electronics & Communication Engineering (EC) 2015 [Session 1]2015
3 questions in this view
2015
Electronics & Communication Engineering (EC) 2015 [Session 2]2015
1 questions in this view
2015
Electronics & Communication Engineering (EC) 2015 [Session 3]2015
2 questions in this view
2015

All Data Interpretation previous year questions

Practice every matching question in batches of 20, with every available option.

1
2015 · General Aptitude (GA) · General Aptitude · Data Interpretation
Electronics & Communication Engineering (EC) 2015 [Session 1]
The waveform of a periodic signal \( x(t) \) is shown in the figure.
A signal \( g(t) \) is defined by \( g(t) = x\left( \frac{t-1}{2} \right) \). The average power of \( g(t) \) is________.

Question diagram

Open complete paper
2
2015 · General Aptitude (GA) · General Aptitude · Data Interpretation
Electronics & Communication Engineering (EC) 2015 [Session 1]
Consider the signal \(s(t) = m(t)\cos(2\pi f_c t) + \hat{m}(t)\sin(2\pi f_c t)\) where \(\hat{m}(t)\) denotes the Hilbert transform of \(m(t)\) and the bandwidth of \(m(t)\) is very small compared to \(f_c\). The signal \(s(t)\) is a
Open complete paper
3
2015 · General Aptitude (GA) · General Aptitude · Data Interpretation
Electronics & Communication Engineering (EC) 2015 [Session 1]
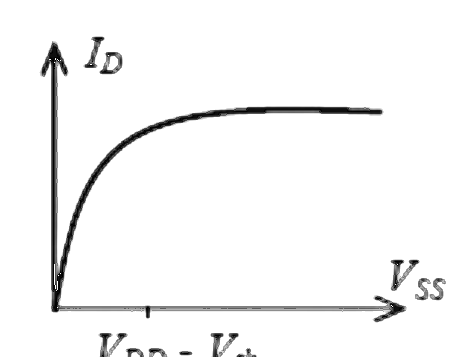
For the NMOSFET in the circuit shown, the threshold voltage is \(V_{th}\), where \(V_{th} > 0\). The source voltage \(V_{SS}\) is varied from 0 to \(V_{DD}\). Neglecting the channel length modulation, the drain current \(I_D\) as a function of \(V_{SS}\) is represented by
Open complete paper
4
2015 · General Aptitude (GA) · General Aptitude · Data Interpretation
Electronics & Communication Engineering (EC) 2015 [Session 2]
Consider a binary, digital communication system which uses pulses \(g(t)\) and \(-g(t)\) for transmitting bits over an AWGN channel. If the receiver uses a matched filter, which one of the following pulses will give the minimum probability of bit error?
Open complete paper
5
2015 · General Aptitude (GA) · General Aptitude · Data Interpretation
Electronics & Communication Engineering (EC) 2015 [Session 3]
In the circuit shown in the figure, the BJT has a current gain (β) of 50. For an emitter-base voltage VEB = 600 mV, the emitter-collector voltage VEC (in Volts) is ______.

Question diagram

Open complete paper
6
2015 · General Aptitude (GA) · General Aptitude · Data Interpretation
Electronics & Communication Engineering (EC) 2015 [Session 3]

The electric field profile in the depletion region of a p-n junction in equilibrium is shown in the figure. Which one of the following statements is NOT TRUE?

Question diagram

Open complete paper