My Cart
Your Cart 0

    Your cart is empty.

  • Total (Amount) ₹0.00
Previous year question hub

Planning Surveys, Demography and Forecasting - Planning History, Theory and Techniques - Architecture and Planning Previous Year Questions

Practice Planning Surveys, Demography and Forecasting - Planning History, Theory and Techniques - Architecture and Planning previous year questions organised from real papers, with year-wise coverage and clear topic navigation.

14Papers
14Years
31Questions
1Topics

Planning Surveys, Demography and Forecasting question pattern

Every graph below is calculated only from this selection.

Questions by year

Compare question counts across years.

Difficulty distribution

How the classified questions are distributed by difficulty.

Easy 21 67.7%
Medium 10 32.3%

Question type distribution

MCQ, numerical, multiple-select and other formats found in these papers.

MCQ 17 54.8%
Numerical Answer Type (NAT) 13 41.9%
MSQ 1 3.2%

Subject weightage

Top subjects by unique question coverage.

Architecture and Planning
31 Qs

Most asked topics

Top topics across the included previous year papers.

Planning History, Theory and Techniques
31 Qs

Subtopic coverage

Top subtopics inside this exact selection.

Planning Surveys, Demography and Forecasting
31 Qs

Paper coverage

Question coverage for the most populated papers. Every active PYP paper remains listed below.

Architecture and Planning (AR) 2026
3 Qs
Architecture and Planning (AR) 2025
1 Qs
Architecture and Planning (AR) 2024
3 Qs
Architecture and Planning (AR) 2023
3 Qs
Architecture and Planning (AR) 2022
2 Qs
Architecture and Planning (AR) 2020
1 Qs
Architecture and Planning (AR) 2019
1 Qs
Architecture and Planning (AR) 2017
3 Qs
Architecture and Planning (AR) 2016
3 Qs
Architecture and Planning (AR) 2011
1 Qs
Architecture and Planning (AR) 2010
2 Qs
Architecture and Planning (AR) 2009
2 Qs
Architecture and Planning (AR) 2008
2 Qs
Architecture and Planning (AR) 2007
4 Qs

Included previous year papers

Newest papers appear first. Search these papers or sort by year and name.

Paper nameYearPDFAttempt
Architecture and Planning (AR) 20262026
3 questions in this view
2026
Architecture and Planning (AR) 20252025
1 questions in this view
2025
Architecture and Planning (AR) 20242024
3 questions in this view
2024
Architecture and Planning (AR) 20232023
3 questions in this view
2023
Architecture and Planning (AR) 20222022
2 questions in this view
2022
Architecture and Planning (AR) 20202020
1 questions in this view
2020
Architecture and Planning (AR) 20192019
1 questions in this view
2019
Architecture and Planning (AR) 20172017
3 questions in this view
2017
Architecture and Planning (AR) 20162016
3 questions in this view
2016
Architecture and Planning (AR) 20112011
1 questions in this view
2011
Architecture and Planning (AR) 20102010
2 questions in this view
2010
Architecture and Planning (AR) 20092009
2 questions in this view
2009
Architecture and Planning (AR) 20082008
2 questions in this view
2008
Architecture and Planning (AR) 20072007
4 questions in this view
2007

All Planning Surveys, Demography and Forecasting previous year questions

Practice every matching question in batches of 20, with every available option.

1
2007 · Architecture and Planning · Planning History, Theory and Techniques · Planning Surveys, Demography and Forecasting
Architecture and Planning (AR) 2007

In urban planning, cohort refers to

Open complete paper
2
2007 · Architecture and Planning · Planning History, Theory and Techniques · Planning Surveys, Demography and Forecasting
Architecture and Planning (AR) 2007
A site has a uniform slope of 6 %. The site map has seven contour lines with the elevation of the highest contour as +53 metres. If the distance between the midpoints of the highest and the lowest contours is 700 metres, then the contour interval in metres is
Open complete paper
3
2007 · Architecture and Planning · Planning History, Theory and Techniques · Planning Surveys, Demography and Forecasting
Architecture and Planning (AR) 2007

A sector has a gross density of 250 persons per hectare and a net density of 400 persons per hectare. If the area of the sector is 120 hectares, then the percentage of non-residential area is

Open complete paper
4
2007 · Architecture and Planning · Planning History, Theory and Techniques · Planning Surveys, Demography and Forecasting
Architecture and Planning (AR) 2007
A town has 16,000 existing dwelling units of which 10 % are dilapidated. If the housing need is 8,700 dwellings units and the average household size is 4.5, then the population of the town is
Open complete paper
5
2008 · Architecture and Planning · Planning History, Theory and Techniques · Planning Surveys, Demography and Forecasting
Architecture and Planning (AR) 2008

Match the diagrams of Age-Sex pyramids from the descriptions of the population growth, given below:

Question diagram

Open complete paper
6
2008 · Architecture and Planning · Planning History, Theory and Techniques · Planning Surveys, Demography and Forecasting
Architecture and Planning (AR) 2008
As per the table given in Q. No. 74 the Annual Growth Rate of urban population of India during 1921 – 31 was:
Open complete paper
7
2009 · Architecture and Planning · Planning History, Theory and Techniques · Planning Surveys, Demography and Forecasting
Architecture and Planning (AR) 2009

A neighbourhood with a total area of 200 hectares has a gross density of 300 persons per hectare (pph). If the residential area is 60% of the total area, then net density (in pph) of the neighbourhood is

Open complete paper
8
2009 · Architecture and Planning · Planning History, Theory and Techniques · Planning Surveys, Demography and Forecasting
Architecture and Planning (AR) 2009

A town with a population of 50000 has an average household size of 5.0. The number of occupied dwelling units is 8400 of which 10% are in dilapidated condition. The housing demand of the town is

Open complete paper
9
2010 · Architecture and Planning · Planning History, Theory and Techniques · Planning Surveys, Demography and Forecasting
Architecture and Planning (AR) 2010
Annual housing demand of a metropolitan city is estimated through the combination of the following components. Identify the correct combination.
P. New Entrants to the City
Q. Elderly Population Living in Cities
R. New Relocated Slum Dwellers
S. Slum Squatter Dwellers
T. Unauthorized Dwelling Units
U. Dilapidated Houses
V. Part of Backlog
W. Any Other Houses
Open complete paper
10
2010 · Architecture and Planning · Planning History, Theory and Techniques · Planning Surveys, Demography and Forecasting
Architecture and Planning (AR) 2010
The age-sex compositions of three communities are represented by the diagrams P, Q and R as shown below.
Each of them implies a strong socio-economic characteristic as indicated below.
1. Aging community
2. Economically vibrant community
3. Multi ethnic community
4. Young community with high birth rate
Identify the correct set out of the following

Question diagram

Open complete paper
11
2011 · Architecture and Planning · Planning History, Theory and Techniques · Planning Surveys, Demography and Forecasting
Architecture and Planning (AR) 2011
The gross density of the residential sector in persons per hectare would be
Open complete paper
12
2016 · Architecture and Planning · Planning History, Theory and Techniques · Planning Surveys, Demography and Forecasting
Architecture and Planning (AR) 2016

The components measuring Human Development Index (HDI) of a nation are

Open complete paper
13
2016 · Architecture and Planning · Planning History, Theory and Techniques · Planning Surveys, Demography and Forecasting
Architecture and Planning (AR) 2016
In a residential neighbourhood, the net area of residential plots is 50 percent of the total area. If the population is 8000, the ratio of net density to gross density of the neighbourhood is ______
Open complete paper
14
2016 · Architecture and Planning · Planning History, Theory and Techniques · Planning Surveys, Demography and Forecasting
Architecture and Planning (AR) 2016
In 2001, the population and work force participation rate of a town were 30,000 and 30 percent respectively. The work force participation rate in the year 2011 increased to 34 percent. If the decadal population growth rate was 6 percent, the increase in the number of working people in the town in 2011 was ____________________
Open complete paper
15
2017 · Architecture and Planning · Planning History, Theory and Techniques · Planning Surveys, Demography and Forecasting
Architecture and Planning (AR) 2017

In 2011, the population of a town was 5,00,000 and the number of housing units were 1,00,000. Calculate the additional number of dwelling units (DU) required by 2031 so that there is no housing shortage. The assumptions are i. 5% decadal increase in population ii. New DU to be completed by 2021 is 10,000 iii. Number of DU which will become non habitable by 2031 is 5,000 iv. Average household size is 4.5

Open complete paper
16
2017 · Architecture and Planning · Planning History, Theory and Techniques · Planning Surveys, Demography and Forecasting
Architecture and Planning (AR) 2017
In year 2001, a district with 4,000 manufacturing jobs had a 10% share of total manufacturing jobs within the state. In year 2011, the state recorded 15% drop in manufacturing jobs whereas, share of the district in total manufacturing jobs within the state increased to 15%. Additional manufacturing jobs created in the district between year 2001 and 2011 is ____________________
Open complete paper
17
2017 · Architecture and Planning · Planning History, Theory and Techniques · Planning Surveys, Demography and Forecasting
Architecture and Planning (AR) 2017
Match the planning tasks in Group I with the tools of analysis in Group II
Group I
(P) Population projection
(Q) Regional resource allocation
(R) Trip distribution
(S) Design of water distribution network
Group II
1. Input-Output Analysis
2. Hardy Cross Method
3. Cohort Analysis
4. Gravity Model
5. Moving observer method
Open complete paper
18
2019 · Architecture and Planning · Planning History, Theory and Techniques · Planning Surveys, Demography and Forecasting
Architecture and Planning (AR) 2019
A residential area of 20 hectares is planned for three different types of plots of 500 m², 300 m² and 200 m² with numbers of plot in each category are 100, 120 and 150 respectively. The rest of the area is allocated for roads and facilities such as schools, shops and parks. Each plot has one dwelling unit and the average household size is 5 persons.
The net residential density of the area in persons per hectare is ______.
Open complete paper
19
2020 · Architecture and Planning · Planning History, Theory and Techniques · Planning Surveys, Demography and Forecasting
Architecture and Planning (AR) 2020
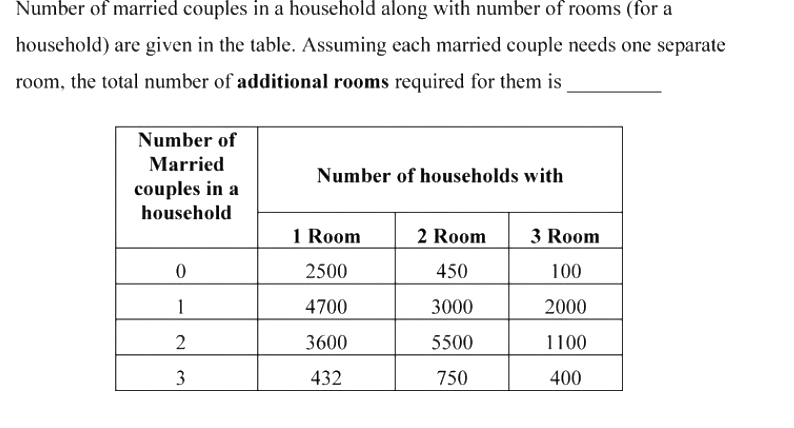
Number of married couples in a household along with number of rooms (for a household) are given in the table. Assuming each married couple needs one separate room, the total number of additional rooms required for them is ________

Question diagram

Open complete paper
20
2022 · Architecture and Planning · Planning History, Theory and Techniques · Planning Surveys, Demography and Forecasting
Architecture and Planning (AR) 2022
The decadal population data of a city are given in the following Table. The domestic water consumption of the city is estimated to be 175 litres per capita per day in the year 2041. Considering 2011 population as the base year and using arithmetic growth method of population forecasting, the daily domestic water demand of the city in the year 2041 (in million litres per day, rounded off to two decimal places) will be __________.
Year1981199120012011
Population1,80,7501,95,8502,15,3002,45,450
Open complete paper

Showing 20 of 31 questions