My Cart
Your Cart 0

    Your cart is empty.

  • Total (Amount) ₹0.00
Previous year question hub

Data Interpretation - General Aptitude - General Aptitude (GA) Previous Year Questions

Practice Data Interpretation - General Aptitude - General Aptitude (GA) previous year questions organised from real papers, with year-wise coverage and clear topic navigation.

3Papers
3Years
10Questions
1Topics

Data Interpretation question pattern

Every graph below is calculated only from this selection.

Questions by year

Year-wise coverage for Data Interpretation. Each bar uses a separate theme-derived color.

Difficulty distribution

How the classified questions are distributed by difficulty.

Medium 7 70%
Easy 3 30%

Question type distribution

MCQ, numerical, multiple-select and other formats found in these papers.

MCQ 10 100%

Subject weightage

Top subjects by unique question coverage.

General Aptitude (GA)
10 Qs

Most asked topics

Top topics across the included previous year papers.

General Aptitude
10 Qs

Subtopic coverage

Top subtopics inside this exact selection.

Data Interpretation
10 Qs

Paper coverage

Question coverage for the most populated papers. Every active PYP paper remains listed below.

Ecology and Evolution (EY) 2025
1 Qs
Ecology and Evolution (EY) 2024
1 Qs
Ecology and Evolution (EY) 2015
8 Qs

Included previous year papers

Newest papers appear first. Sort by year, question coverage or name.

PaperYear / sessionQuestions in this viewOpen
Ecology and Evolution (EY) 202520251View paper
Ecology and Evolution (EY) 202420241View paper
Ecology and Evolution (EY) 201520158View paper

All Data Interpretation previous year questions

Practice every matching question in batches of 20, with every available option.

1
2015 · General Aptitude (GA) · General Aptitude · Data Interpretation
Ecology and Evolution (EY) 2015

Among forests of the following states, tree diversity (e.g., species richness per unit area) is high in: P) Arunachal, Q) Haryana, R) Kerala, S) Punjab, T) Rajasthan.

Open complete paper
2
2015 · General Aptitude (GA) · General Aptitude · Data Interpretation
Ecology and Evolution (EY) 2015
Acoustic signals degrade most rapidly in which of the following environments?

Question diagram

Open complete paper
3
2015 · General Aptitude (GA) · General Aptitude · Data Interpretation
Ecology and Evolution (EY) 2015
In the schematic below, the circles and triangles represent climatic zones occupied by two different biomes along gradients of precipitation and temperature. Which of the following is an accurate description of these biomes?
Open complete paper
4
2015 · General Aptitude (GA) · General Aptitude · Data Interpretation
Ecology and Evolution (EY) 2015
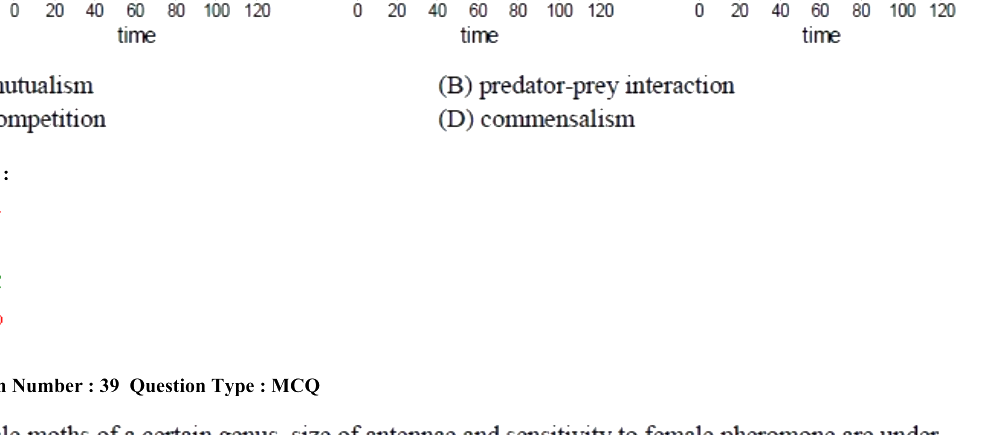
The figure panels below show population growth in two species (solid circles and open circles), when they are grown alone, and when they are grown together. The interaction between these species is an example of

(A) mutualism    (B) predator-prey interaction
(C) competition    (D) commensalism

Question diagram

Open complete paper
5
2015 · General Aptitude (GA) · General Aptitude · Data Interpretation
Ecology and Evolution (EY) 2015
The figure below shows how feeding rate varies with age (old/young) and with body size (small/large) in males of a deer species. Based on this figure, which of the statements below is FALSE?

(A) Large old males have higher feeding rates than large young males
(B) Large young males have higher feeding rates than small young males
(C) Regardless of size, feeding rate is higher in old males than in young males
(D) Regardless of age, feeding rate is higher in small males than in large males

Question diagram

Open complete paper
6
2015 · General Aptitude (GA) · General Aptitude · Data Interpretation
Ecology and Evolution (EY) 2015
Breeding males in a population show two alternative mating tactics: T1 and T2. These two tactics are hypothesized to be maintained by negative frequency-dependent effects on fitness. Which figure below represents negative frequency-dependence acting on the two tactics?

(A) Figure A
(B) Figure B
(C) Figure C
(D) Figure D

Question diagram

Open complete paper
7
2015 · General Aptitude (GA) · General Aptitude · Data Interpretation
Ecology and Evolution (EY) 2015
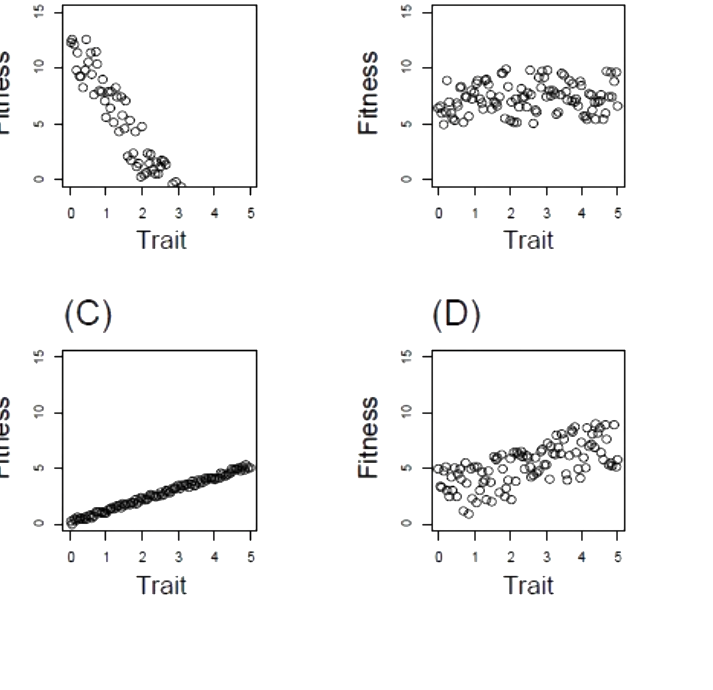
In which of the following four plots, showing reproductive fitness versus a trait, is the strength of selection MAXIMUM?

Question diagram

Open complete paper
8
2015 · General Aptitude (GA) · General Aptitude · Data Interpretation
Ecology and Evolution (EY) 2015
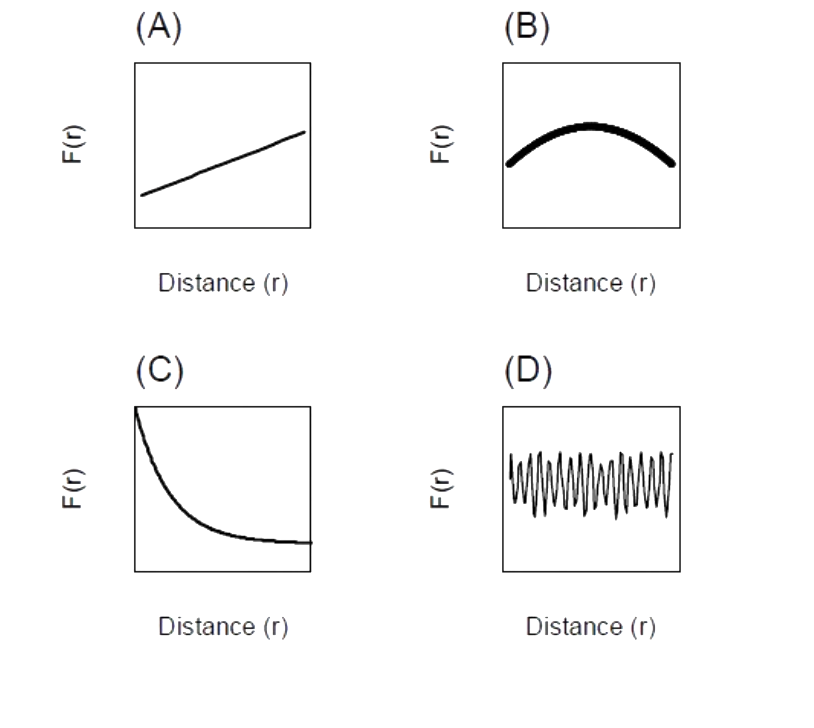
In a large forested landscape, where seed dispersal is the ONLY determinant of tree species distribution, two individual trees were randomly picked at a distance r units apart. If F(r) is the probability that the two individuals belong to the same species, which of the following figures shows how F(r) changes with r?

Question diagram

Open complete paper
9
2024 · General Aptitude (GA) · General Aptitude · Data Interpretation
Ecology and Evolution (EY) 2024
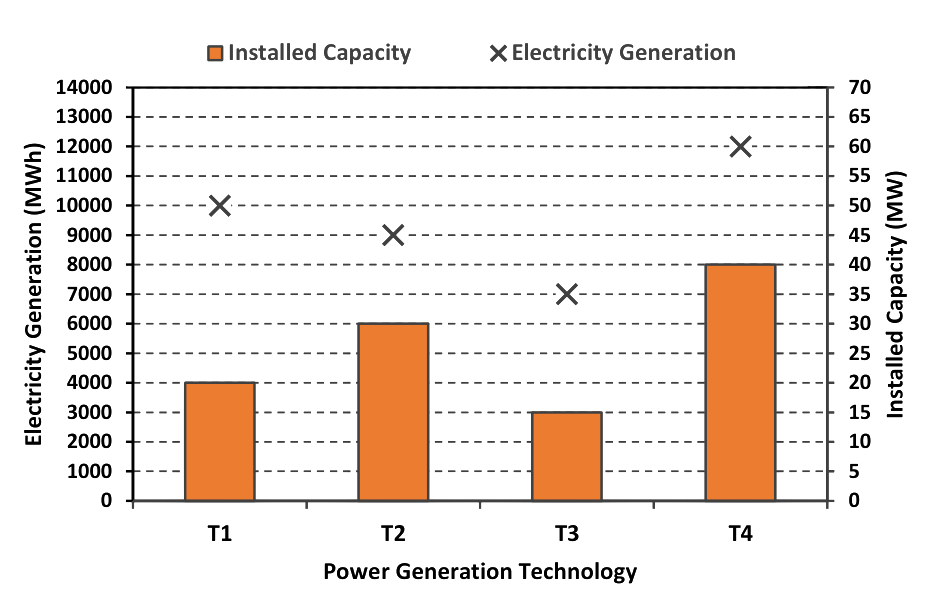
The chart given below compares the Installed Capacity (MW) of four power generation technologies, T1, T2, T3, and T4, and their Electricity Generation (MWh) in a time of 1000 hours (h).

The Capacity Factor of a power generation technology is:
\[ \text{Capacity Factor} = \frac{\text{Electricity Generation (MWh)}}{\text{Installed Capacity (MW)} \times 1000 \text{ (h)}} \]
Which one of the given technologies has the highest Capacity Factor?

Question diagram

Open complete paper
10
2025 · General Aptitude (GA) · General Aptitude · Data Interpretation
Ecology and Evolution (EY) 2025

The table lists the top 5 nations according to the number of gold medals won in a tournament; also included are the number of silver and the bronze medals won by them. Based only on the data provided in the table, which one of the following statements is INCORRECT?

NationGoldSilverBronze
USA404441
Canada392724
Japan201213
Australia171916
France162622
Open complete paper