My Cart
Your Cart 0

    Your cart is empty.

  • Total (Amount) ₹0.00
Previous year question hub

Population and Quantitative Genetics - Evolution - Ecology and Evolution Previous Year Questions

Practice Population and Quantitative Genetics - Evolution - Ecology and Evolution previous year questions organised from real papers, with year-wise coverage and clear topic navigation.

11Papers
11Years
39Questions
1Topics

Population and Quantitative Genetics question pattern

Every graph below is calculated only from this selection.

Questions by year

Year-wise coverage for Population and Quantitative Genetics. Each bar uses a separate theme-derived color.

Difficulty distribution

How the classified questions are distributed by difficulty.

Easy 27 69.2%
Medium 12 30.8%

Question type distribution

MCQ, numerical, multiple-select and other formats found in these papers.

MCQ 26 66.7%
Numerical Answer Type (NAT) 8 20.5%
Fill in the blanks 3 7.7%
MSQ 2 5.1%

Subject weightage

Top subjects by unique question coverage.

Ecology and Evolution
39 Qs

Most asked topics

Top topics across the included previous year papers.

Evolution
39 Qs

Subtopic coverage

Top subtopics inside this exact selection.

Population and Quantitative Genetics
39 Qs

Paper coverage

Question coverage for the most populated papers. Every active PYP paper remains listed below.

Ecology and Evolution (EY) 2025
2 Qs
Ecology and Evolution (EY) 2024
6 Qs
Ecology and Evolution (EY) 2023
4 Qs
Ecology and Evolution (EY) 2022
3 Qs
Ecology and Evolution (EY) 2021
4 Qs
Ecology and Evolution (EY) 2020
4 Qs
Ecology and Evolution (EY) 2019
2 Qs
Ecology and Evolution (EY) 2018
3 Qs
Ecology and Evolution (EY) 2016
6 Qs
Ecology and Evolution (EY) 2015
2 Qs
Ecology and Evolution (EY) 2014
3 Qs

Included previous year papers

Newest papers appear first. Sort by year, question coverage or name.

PaperYear / sessionQuestions in this viewOpen
Ecology and Evolution (EY) 202520252View paper
Ecology and Evolution (EY) 202420246View paper
Ecology and Evolution (EY) 202320234View paper
Ecology and Evolution (EY) 202220223View paper
Ecology and Evolution (EY) 202120214View paper
Ecology and Evolution (EY) 202020204View paper
Ecology and Evolution (EY) 201920192View paper
Ecology and Evolution (EY) 201820183View paper
Ecology and Evolution (EY) 201620166View paper
Ecology and Evolution (EY) 201520152View paper
Ecology and Evolution (EY) 201420143View paper

All Population and Quantitative Genetics previous year questions

Practice every matching question in batches of 20, with every available option.

1
2014 · Ecology and Evolution · Evolution · Population and Quantitative Genetics
Ecology and Evolution (EY) 2014
The frequency of the dominant allele (\( R \)) in a population of diploid organisms is equal to the frequency of the recessive white allele (\( r \)). The frequency of red individuals assuming Hardy-Weinberg equilibrium (express the frequency using decimal notation, not as a fraction or a percentage) ______________
Open complete paper
2
2014 · Ecology and Evolution · Evolution · Population and Quantitative Genetics
Ecology and Evolution (EY) 2014
A recent experiment with a fast growing variety of tomato studied the inheritance of two traits – dwarfism and flower colour. The experiment successfully demonstrated Mendel’s law of segregation and for both traits the expected 3:1 ratio of dominant to recessive phenotype was observed. However, the experiment failed to demonstrate the law of independent assortment for the two traits. One possible reason for this is
Open complete paper
3
2014 · Ecology and Evolution · Evolution · Population and Quantitative Genetics
Ecology and Evolution (EY) 2014
All adults of a fish species have bright colour patterns in population P and all adults have dull colour patterns in population Q. Colour patterns in this species are determined early in development. Which of the following study designs is best suited to test whether this colour pattern difference has a genetic basis?
Open complete paper
4
2015 · Ecology and Evolution · Evolution · Population and Quantitative Genetics
Ecology and Evolution (EY) 2015
A genetic locus has only two alleles in a population. The frequency of heterozygotes in that population is 0.32. Assuming Hardy-Weinberg equilibrium, the frequency (in decimal notation, not in fractions or percentage) of the rarer allele is __________
Open complete paper
5
2015 · Ecology and Evolution · Evolution · Population and Quantitative Genetics
Ecology and Evolution (EY) 2015

Which of the following processes typically does NOT contribute to increase in genetic variation?

Open complete paper
6
2018 · Ecology and Evolution · Evolution · Population and Quantitative Genetics
Ecology and Evolution (EY) 2018

Natural populations often deviate from Hardy-Weinberg equilibrium. One possible reason for this is

Open complete paper
7
2018 · Ecology and Evolution · Evolution · Population and Quantitative Genetics
Ecology and Evolution (EY) 2018

Consider a diploid population at Hardy-Weinberg equilibrium. For a locus with two alleles, the frequency of the A1A1 genotype is 0.01. The frequency of heterozygotes A1A2 is ____ (answer up to 2 decimal places).

Open complete paper
8
2018 · Ecology and Evolution · Evolution · Population and Quantitative Genetics
Ecology and Evolution (EY) 2018
A parent population (P) is split into three daughter populations (Q, R, and S) which grow in three different habitats. After 1000 generations, the equilibrium frequency distribution of a trait in each of the daughter populations is shown in the figure below. For reference, the vertical line represents the mean of the parent population.

From this information, one can infer that the subpopulations experienced the following selection regimes
Open complete paper
9
2019 · Ecology and Evolution · Evolution · Population and Quantitative Genetics
Ecology and Evolution (EY) 2019

A large proportion of individuals in a particular population of humans carry the allele for colour-blindness. Assuming colour-blindness does not confer any evolutionary advantage, which of the following mechanisms CANNOT explain the unusual abundance of this allele?

Open complete paper
10
2019 · Ecology and Evolution · Evolution · Population and Quantitative Genetics
Ecology and Evolution (EY) 2019

Two true-breeding lines of a moth, one with black wings and the other with red wings, are crossed. All of the resulting offspring in the F1 generation had red wings. These offspring are crossed to produce the F2 generation of moths where the expected fraction of moths with black wings in the population is _____ (round off to two decimal places).

Open complete paper
11
2020 · Ecology and Evolution · Evolution · Population and Quantitative Genetics
Ecology and Evolution (EY) 2020

Which of the following processes contributes to an increase in genetic variation?

Open complete paper
12
2020 · Ecology and Evolution · Evolution · Population and Quantitative Genetics
Ecology and Evolution (EY) 2020

In a population of infinite size, the frequency of two alleles A1 and A2 at a neutral locus are the same. What are the expected genotype frequencies (A1A1, A1A2, A2A2) after 100 generations of random mating?

Open complete paper
13
2020 · Ecology and Evolution · Evolution · Population and Quantitative Genetics
Ecology and Evolution (EY) 2020

In a polyploidization event, tetraploid progeny were formed by diploid parents. Hybridization between the tetraploid and a diploid parent gave rise to sterile triploids. Which of the following best explains why these triploids were sterile?

Open complete paper
14
2020 · Ecology and Evolution · Evolution · Population and Quantitative Genetics
Ecology and Evolution (EY) 2020
In a population of 100 individuals of a diploid organism with 1:1 sex ratio, the probability of fixation of a new neutral mutation is _____ (round off to three decimal places).
Open complete paper
15
2021 · Ecology and Evolution · Evolution · Population and Quantitative Genetics
Ecology and Evolution (EY) 2021
Which of the following is/are possible reason(s) for linkage disequilibrium between alleles at two loci?
Open complete paper
16
2021 · Ecology and Evolution · Evolution · Population and Quantitative Genetics
Ecology and Evolution (EY) 2021
The graph shows the relationship between a variable on the x-axis and genetic diversity on the y-axis. Each point represents a species and the trend line describes the relationship across species.

Select the most appropriate variable for the x-axis.
Open complete paper
17
2021 · Ecology and Evolution · Evolution · Population and Quantitative Genetics
Ecology and Evolution (EY) 2021
At a locus with two alleles A1 and A2, the genotype A1A1 produces white flowers, A2A2 produces red flowers, and A1A2 produces pink flowers. For a population in Hardy-Weinberg equilibrium, the frequency of red flowers is 0.25. If the white flowered plants are removed, and all pink and red flowered-plants in this population are randomly crossed amongst each other, the frequency of white flowered plants in the next generation will be __________. (Round off to two decimal places.)
Open complete paper
18
2021 · Ecology and Evolution · Evolution · Population and Quantitative Genetics
Ecology and Evolution (EY) 2021
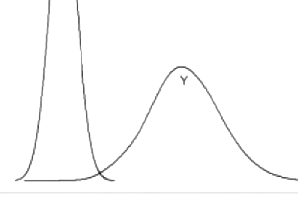
The frequency distributions of a trait in two populations, X and Y, are shown in the figure.

Which one of the following statements about the mean and standard deviation (SD) of the two populations is accurate?

Question diagram

Open complete paper
19
2024 · Ecology and Evolution · Evolution · Population and Quantitative Genetics
Ecology and Evolution (EY) 2024

A few years ago, a very small population of zebrafish became isolated by a newly built dam. As a result, which statement is most likely to be true about this population of zebrafish now?

Open complete paper
20
2024 · Ecology and Evolution · Evolution · Population and Quantitative Genetics
Ecology and Evolution (EY) 2024

In a population, there are two morphs, A and B, which reproduce at equal rates. A mutates to B with probability p1, and B mutates to A with probability p2 such that p1 ≫ p2 (that is, p1 is much greater than p2). Over time, which one of the following statements would be true about this population?

Open complete paper

Showing 20 of 39 questions