Difficulty distribution
How the classified questions are distributed by difficulty.
Your cart is empty.
Practice Population Ecology - Ecology - Ecology and Evolution previous year questions organised from real papers, with year-wise coverage and clear topic navigation.
Every graph below is calculated only from this selection.
Year-wise coverage for Population Ecology. Each bar uses a separate theme-derived color.
How the classified questions are distributed by difficulty.
MCQ, numerical, multiple-select and other formats found in these papers.
Top subjects by unique question coverage.
Top topics across the included previous year papers.
Top subtopics inside this exact selection.
Question coverage for the most populated papers. Every active PYP paper remains listed below.
Newest papers appear first. Sort by year, question coverage or name.
| Paper | Year / session | Questions in this view | Open |
|---|---|---|---|
| Ecology and Evolution (EY) 2025 | 2025 | 3 | View paper |
| Ecology and Evolution (EY) 2024 | 2024 | 6 | View paper |
| Ecology and Evolution (EY) 2023 | 2023 | 6 | View paper |
| Ecology and Evolution (EY) 2022 | 2022 | 2 | View paper |
| Ecology and Evolution (EY) 2021 | 2021 | 4 | View paper |
| Ecology and Evolution (EY) 2020 | 2020 | 2 | View paper |
| Ecology and Evolution (EY) 2019 | 2019 | 5 | View paper |
| Ecology and Evolution (EY) 2018 | 2018 | 4 | View paper |
| Ecology and Evolution (EY) 2016 | 2016 | 1 | View paper |
| Ecology and Evolution (EY) 2015 | 2015 | 1 | View paper |
| Ecology and Evolution (EY) 2014 | 2014 | 2 | View paper |
Practice every matching question in batches of 20, with every available option.
Increased anthropogenic disturbance has resulted in an overall decrease in densities of trees and an increase in fragmentation of forests. Which of the following types of trees will have the greatest reduction in reproductive success?
A population grows from a size of 100 individuals at t = 0, to 1000 individuals at t = 100, following density-independent growth. The ratio of per-capita growth rates at the initial (at t = 0) to the final (t = 100) time is ____.
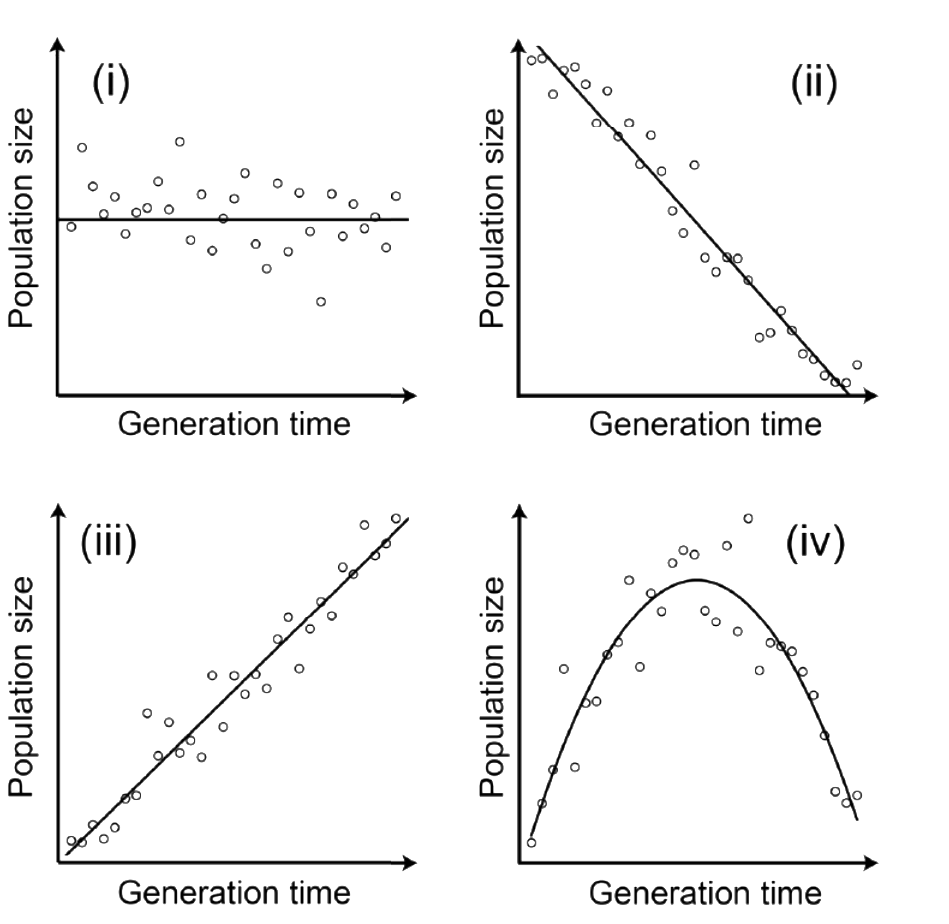
Which of the following plots describes the expected relationship between population size (y-axis) and generation time (x-axis) in vertebrates? Here, each data point represents a different vertebrate species and the generation time is defined as the average interval between two generations.


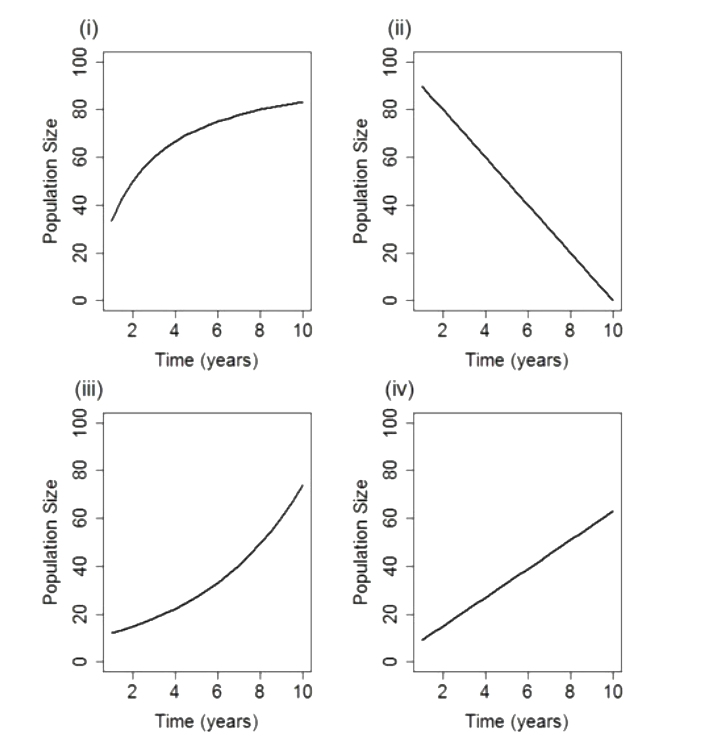
A population of unicorns is growing over time, but its rate of growth is declining. Which of the following graphs best represents this pattern of growth?

The population size at which net recruitment is the highest is also when the greatest amount can be harvested, while ensuring the long-term survival of the population. The amount harvested at this population size is known as
Showing 20 of 36 questions