My Cart
Your Cart 0

    Your cart is empty.

  • Total (Amount) ₹0.00
Previous year question hub

Ecosystem Structure and Function - Ecology - Ecology and Evolution Previous Year Questions

Practice Ecosystem Structure and Function - Ecology - Ecology and Evolution previous year questions organised from real papers, with year-wise coverage and clear topic navigation.

10Papers
10Years
25Questions
1Topics

Ecosystem Structure and Function question pattern

Every graph below is calculated only from this selection.

Questions by year

Year-wise coverage for Ecosystem Structure and Function. Each bar uses a separate theme-derived color.

Difficulty distribution

How the classified questions are distributed by difficulty.

Easy 16 64%
Medium 9 36%

Question type distribution

MCQ, numerical, multiple-select and other formats found in these papers.

MCQ 23 92%
Numerical Answer Type (NAT) 1 4%
MSQ 1 4%

Subject weightage

Top subjects by unique question coverage.

Ecology and Evolution
25 Qs

Most asked topics

Top topics across the included previous year papers.

Ecology
25 Qs

Subtopic coverage

Top subtopics inside this exact selection.

Ecosystem Structure and Function
25 Qs

Paper coverage

Question coverage for the most populated papers. Every active PYP paper remains listed below.

Ecology and Evolution (EY) 2025
4 Qs
Ecology and Evolution (EY) 2023
2 Qs
Ecology and Evolution (EY) 2022
2 Qs
Ecology and Evolution (EY) 2021
3 Qs
Ecology and Evolution (EY) 2020
1 Qs
Ecology and Evolution (EY) 2019
2 Qs
Ecology and Evolution (EY) 2018
4 Qs
Ecology and Evolution (EY) 2016
2 Qs
Ecology and Evolution (EY) 2015
1 Qs
Ecology and Evolution (EY) 2014
4 Qs

Included previous year papers

Newest papers appear first. Sort by year, question coverage or name.

PaperYear / sessionQuestions in this viewOpen
Ecology and Evolution (EY) 202520254View paper
Ecology and Evolution (EY) 202320232View paper
Ecology and Evolution (EY) 202220222View paper
Ecology and Evolution (EY) 202120213View paper
Ecology and Evolution (EY) 202020201View paper
Ecology and Evolution (EY) 201920192View paper
Ecology and Evolution (EY) 201820184View paper
Ecology and Evolution (EY) 201620162View paper
Ecology and Evolution (EY) 201520151View paper
Ecology and Evolution (EY) 201420144View paper

All Ecosystem Structure and Function previous year questions

Practice every matching question in batches of 20, with every available option.

1
2014 · Ecology and Evolution · Ecology · Ecosystem Structure and Function
Ecology and Evolution (EY) 2014

On average, which ecosystem has the LOWEST net primary productivity per unit area?

Open complete paper
2
2014 · Ecology and Evolution · Ecology · Ecosystem Structure and Function
Ecology and Evolution (EY) 2014
Human activities release about \( 7 \times 10^{15} \) g of \( CO_2 \) into the atmosphere every year. Of this, about \( 3 \times 10^{15} \) g accumulates in the atmosphere. Another \( 2 \times 10^{15} \) g is absorbed by the oceans. The remaining \( 2 \times 10^{15} \) g enters the “missing carbon sink.” This sink is best explained by which of the following?
Open complete paper
3
2014 · Ecology and Evolution · Ecology · Ecosystem Structure and Function
Ecology and Evolution (EY) 2014

The pyramidal structure of decreasing biomass with increasing trophic level in terrestrial ecosystems is a consequence of:

Open complete paper
4
2014 · Ecology and Evolution · Ecology · Ecosystem Structure and Function
Ecology and Evolution (EY) 2014

Typical green leaves from plants absorb light of the following colour/s:

Open complete paper
5
2015 · Ecology and Evolution · Ecology · Ecosystem Structure and Function
Ecology and Evolution (EY) 2015

Carbon-fixation reactions using RUBISCO and PEP occur in

Open complete paper
6
2018 · Ecology and Evolution · Ecology · Ecosystem Structure and Function
Ecology and Evolution (EY) 2018
In a food chain, the efficiency of transfer of energy from one trophic level to the next is 10%. The PERCENTAGE of energy that is expected to transfer from the second to the fourth level is ____.
Open complete paper
7
2018 · Ecology and Evolution · Ecology · Ecosystem Structure and Function
Ecology and Evolution (EY) 2018
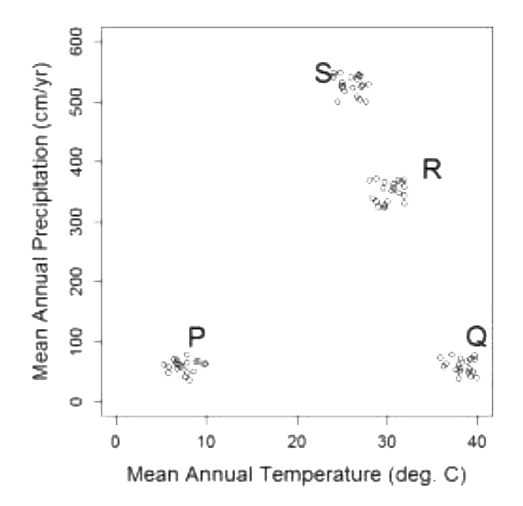
The figure below shows mean annual temperatures (°C) and mean annual precipitation (cm per year) from multiple sites in four regions in India.
From this climatic information, we can infer that P, Q, R, and S are LIKELY to be located in:

Question diagram

Open complete paper
8
2018 · Ecology and Evolution · Ecology · Ecosystem Structure and Function
Ecology and Evolution (EY) 2018
The reactions below (R1 and R2) represent different carbon fixation pathways in photosynthesis.
RuBP represents Ribulose bisphosphate.
Rubisco represents RuBP carboxylase-oxygenase.
PGA represents Phosphoglyceric acid.
PEP represents Phosphoenolpyruvate.
R1. \[ \text{CO}_2 + \text{RuBP} \xrightarrow{\text{Rubisco}} \text{PGA} \]
R2. \[ \text{CO}_2 + \text{PEP} \xrightarrow{\text{PEP-Carboxylase}} \text{Malic Acid} \]
Which of the following is CORRECT?
Open complete paper
9
2018 · Ecology and Evolution · Ecology · Ecosystem Structure and Function
Ecology and Evolution (EY) 2018
A climate scientist notices a trend in atmospheric CO₂ concentrations (in ppm) at a research station. Although overall CO₂ is rising over decades, there are intra-annual fluctuations, as shown in the figure below. These fluctuations can be attributed to
Open complete paper
10
2019 · Ecology and Evolution · Ecology · Ecosystem Structure and Function
Ecology and Evolution (EY) 2019

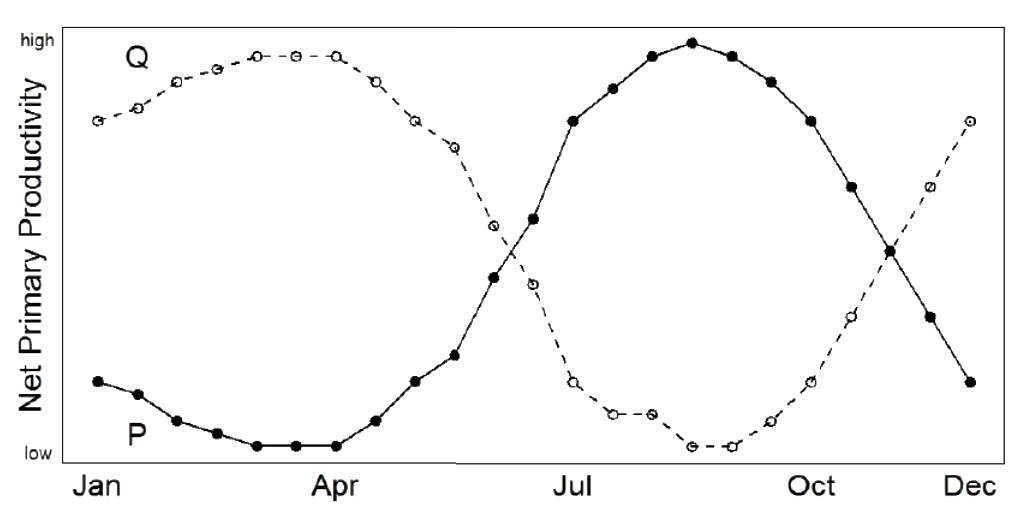
The pattern of net primary productivity in a year for two grassland habitats (P and Q) is shown below. Which of the following statements is consistent with the figure?

Question diagram

Open complete paper
11
2019 · Ecology and Evolution · Ecology · Ecosystem Structure and Function
Ecology and Evolution (EY) 2019

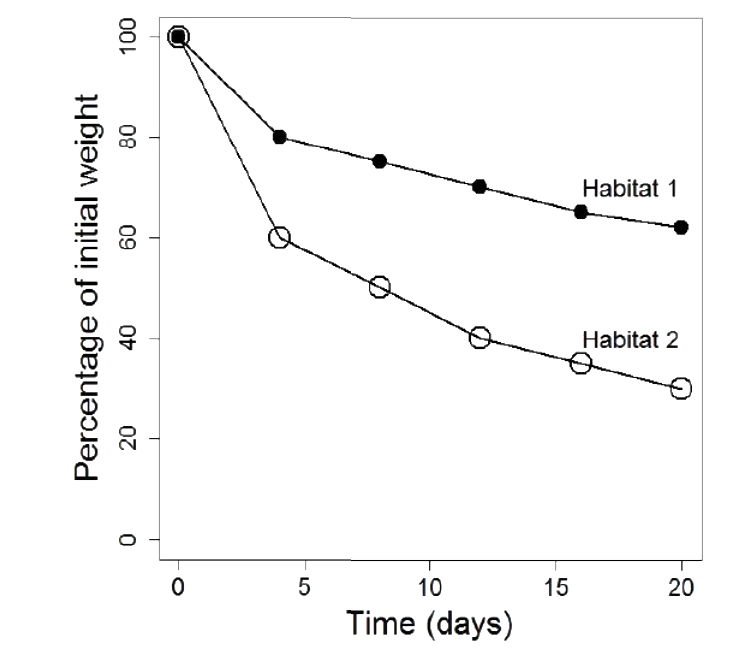
Which of the following statements best explains the patterns of leaf-litter decomposition over time shown in the figure below?

Question diagram

Open complete paper
12
2020 · Ecology and Evolution · Ecology · Ecosystem Structure and Function
Ecology and Evolution (EY) 2020

In a tropical rainforest during the day, which of the following factors does NOT affect the spectral irradiance at the forest floor?

Question diagram

Open complete paper
13
2021 · Ecology and Evolution · Ecology · Ecosystem Structure and Function
Ecology and Evolution (EY) 2021
Rising temperature due to global warming can stimulate decomposition of organic matter and release CO₂ into the atmosphere. This is an example of
Open complete paper
14
2021 · Ecology and Evolution · Ecology · Ecosystem Structure and Function
Ecology and Evolution (EY) 2021
Grazing by large mammalian herbivores can have a strong influence on ecosystem structure, and can cause ecosystems to transition between alternative states over decades. Which one of the following transitions can result from grazing?
Open complete paper
15
2021 · Ecology and Evolution · Ecology · Ecosystem Structure and Function
Ecology and Evolution (EY) 2021
Soils undergo weathering over large time-scales (millions of years). Over time, concentration of phosphorus (P) declines monotonically (solid line), while nitrogen (N) shows a unimodal pattern (dotted line) as shown.
Based on this pattern, which one of the following diagrams represents the likely trend in N:P ratio?
Open complete paper
16
2025 · Ecology and Evolution · Ecology · Ecosystem Structure and Function
Ecology and Evolution (EY) 2025

Across trophic levels, energy flows from producers to primary consumers, and from primary consumers to secondary consumers. Which one of the following options best represents the percentage of energy that is transferred from producers to secondary consumers?

Open complete paper
17
2025 · Ecology and Evolution · Ecology · Ecosystem Structure and Function
Ecology and Evolution (EY) 2025

High water temperatures can cause coral bleaching, which often leads to coral death. In coral reefs that experience repeated bleaching, there can be substantial algal growth on dead coral, eventually leading to an algal dominated ecosystem. Such a transformation is known as

Open complete paper
18
2025 · Ecology and Evolution · Ecology · Ecosystem Structure and Function
Ecology and Evolution (EY) 2025

Which one or more of the following functions do insects directly perform in ecosystems?

Open complete paper
19
2025 · Ecology and Evolution · Ecology · Ecosystem Structure and Function
Ecology and Evolution (EY) 2025
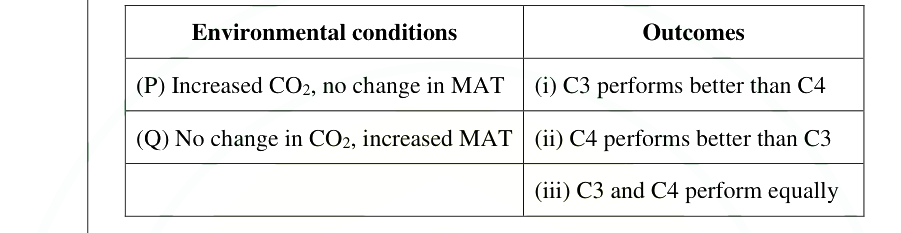
The table below lists potential environmental conditions in future climates, related to atmospheric carbon dioxide concentrations (CO2) and mean annual temperature (MAT).
The table also lists potential outcomes with respect to whether conditions will favour grasses with C3 or C4 photosynthetic pathways.
Assuming no other changes in environmental conditions, match the options in the two columns.
Environmental conditionsOutcomes
(P) Increased CO2, no change in MAT(i) C3 performs better than C4
(Q) No change in CO2, increased MAT(ii) C4 performs better than C3
(iii) C3 and C4 perform equally

Question diagram

Open complete paper
20
2016 · Ecology and Evolution · Ecology · Ecosystem Structure and Function
Ecology and Evolution (EY) 2016
Forests with a high density of native conifer trees are found in:
Open complete paper

Showing 20 of 25 questions