Difficulty distribution
How the classified questions are distributed by difficulty.
Your cart is empty.
Practice Community Ecology - Ecology - Ecology and Evolution previous year questions organised from real papers, with year-wise coverage and clear topic navigation.
Every graph below is calculated only from this selection.
Year-wise coverage for Community Ecology. Each bar uses a separate theme-derived color.
How the classified questions are distributed by difficulty.
MCQ, numerical, multiple-select and other formats found in these papers.
Top subjects by unique question coverage.
Top topics across the included previous year papers.
Top subtopics inside this exact selection.
Question coverage for the most populated papers. Every active PYP paper remains listed below.
Newest papers appear first. Sort by year, question coverage or name.
| Paper | Year / session | Questions in this view | Open |
|---|---|---|---|
| Ecology and Evolution (EY) 2025 | 2025 | 5 | View paper |
| Ecology and Evolution (EY) 2024 | 2024 | 5 | View paper |
| Ecology and Evolution (EY) 2023 | 2023 | 1 | View paper |
| Ecology and Evolution (EY) 2022 | 2022 | 6 | View paper |
| Ecology and Evolution (EY) 2021 | 2021 | 3 | View paper |
| Ecology and Evolution (EY) 2020 | 2020 | 5 | View paper |
| Ecology and Evolution (EY) 2019 | 2019 | 4 | View paper |
| Ecology and Evolution (EY) 2018 | 2018 | 4 | View paper |
| Ecology and Evolution (EY) 2016 | 2016 | 3 | View paper |
| Ecology and Evolution (EY) 2014 | 2014 | 4 | View paper |
Practice every matching question in batches of 20, with every available option.


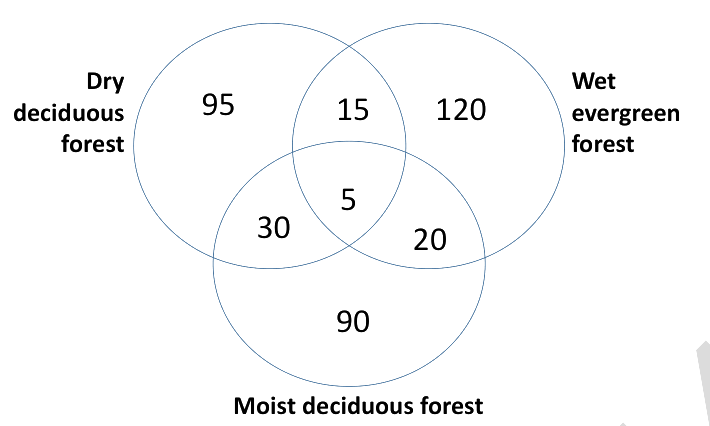
The Venn Diagram below shows numbers of species in three forest types. Which of the following statements is true?

Which of the following diversity indices best captures species turnover across habitats?
Which of the following is NOT typically a characteristic of early successional pioneer plants relative to late successional plants in a tropical rain forest?
The latitudinal diversity gradient is defined as the decrease in the number of species from the equator to the poles. This can result from
According to MacArthur and Wilson’s theory of island biogeography, the number of species on an island is a balance between
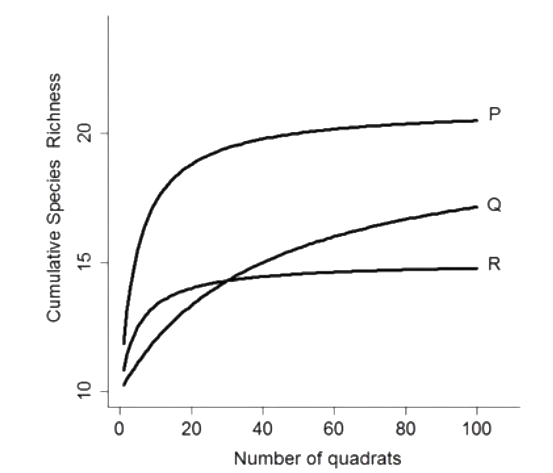
A researcher found n number of woody species in a one hectare tropical forest plot. He employs the same method in another one hectare plot in the same forest. Based on the principle of species area curves, the expected number of new species in the second plot is
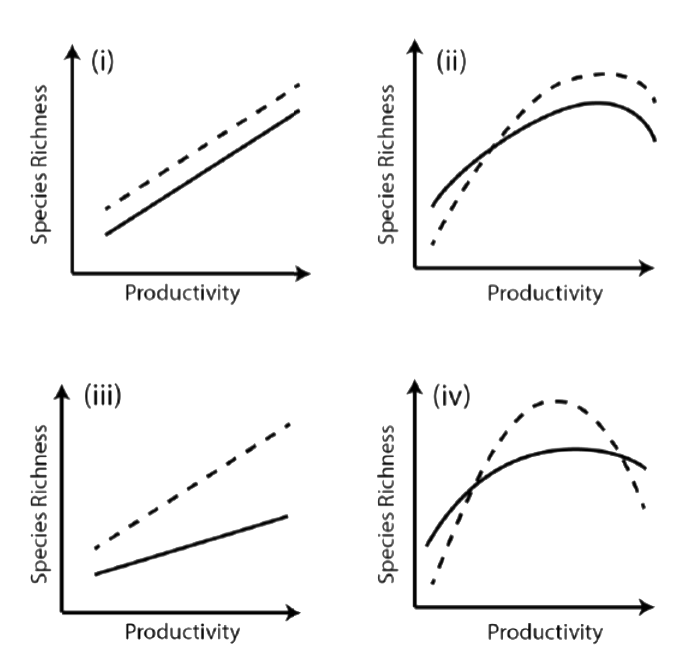
A study found that grazing decreased species richness when productivity was low, and increased species richness when productivity was high. Which of the following figures best represents this result? In the figure, the dotted line represents species richness in grazed plots and the solid line represents species richness in plots without grazing.


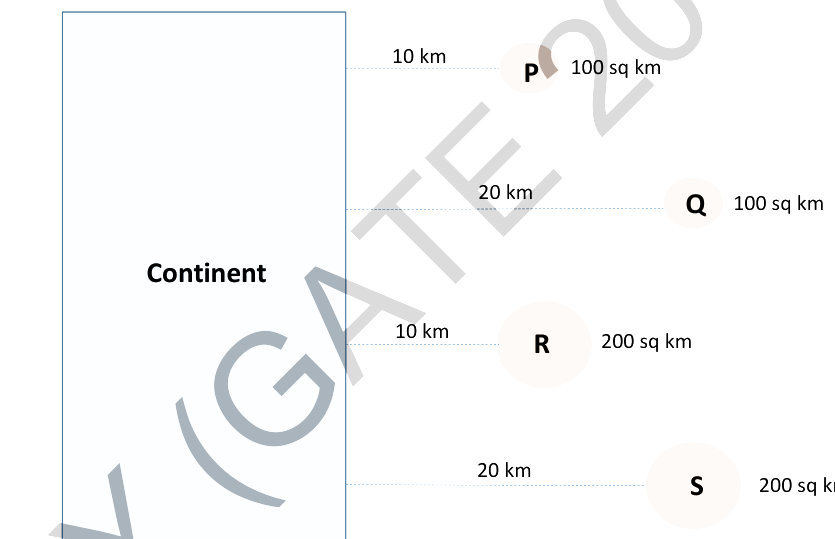
The theory of island biogeography predicts that the number of species on islands is determined by: (i) the rate of colonisation, which depends on the distance of the island from the mainland, and (ii) the rate of extinction, which depends on the size of the island. A researcher surveyed two islands with similar habitats and geological history, and found that both islands have the same number of species. Which of the following statement(s) can explain this observation? P. The islands are of the same size and are at the same distance from the mainland. Q. The islands are of different sizes and are at the same distance from the mainland. R. The islands are of the same size and are at different distances from the mainland. S. The islands are of different sizes and are of different distances from the mainland.
A researcher collects data on plant species composition in two habitats (P and Q) by using 10 quadrats each in both habitats. She calculates the average α-diversity and the β-diversity of each habitat from this data (shown below). Which of the following can be inferred about these habitats?
| Diversity | Habitat-P | Habitat-Q |
|---|---|---|
| α-diversity | 4 | 4 |
| β-diversity | 0.8 | 0.2 |


Showing 20 of 40 questions