My Cart
Your Cart 0

    Your cart is empty.

  • Total (Amount) ₹0.00
Previous year question hub

Global Change - Applied Ecology & Evolution - Ecology and Evolution Previous Year Questions

Practice Global Change - Applied Ecology & Evolution - Ecology and Evolution previous year questions organised from real papers, with year-wise coverage and clear topic navigation.

9Papers
9Years
17Questions
1Topics

Global Change question pattern

Every graph below is calculated only from this selection.

Questions by year

Year-wise coverage for Global Change. Each bar uses a separate theme-derived color.

Difficulty distribution

How the classified questions are distributed by difficulty.

Easy 11 64.7%
Medium 6 35.3%

Question type distribution

MCQ, numerical, multiple-select and other formats found in these papers.

MCQ 14 82.4%
MSQ 3 17.6%

Subject weightage

Top subjects by unique question coverage.

Ecology and Evolution
17 Qs

Most asked topics

Top topics across the included previous year papers.

Applied Ecology & Evolution
17 Qs

Subtopic coverage

Top subtopics inside this exact selection.

Global Change
17 Qs

Paper coverage

Question coverage for the most populated papers. Every active PYP paper remains listed below.

Ecology and Evolution (EY) 2025
2 Qs
Ecology and Evolution (EY) 2024
2 Qs
Ecology and Evolution (EY) 2023
2 Qs
Ecology and Evolution (EY) 2022
1 Qs
Ecology and Evolution (EY) 2021
1 Qs
Ecology and Evolution (EY) 2020
1 Qs
Ecology and Evolution (EY) 2019
3 Qs
Ecology and Evolution (EY) 2018
1 Qs
Ecology and Evolution (EY) 2016
4 Qs

Included previous year papers

Newest papers appear first. Sort by year, question coverage or name.

PaperYear / sessionQuestions in this viewOpen
Ecology and Evolution (EY) 202520252View paper
Ecology and Evolution (EY) 202420242View paper
Ecology and Evolution (EY) 202320232View paper
Ecology and Evolution (EY) 202220221View paper
Ecology and Evolution (EY) 202120211View paper
Ecology and Evolution (EY) 202020201View paper
Ecology and Evolution (EY) 201920193View paper
Ecology and Evolution (EY) 201820181View paper
Ecology and Evolution (EY) 201620164View paper

All Global Change previous year questions

Practice every matching question in batches of 20, with every available option.

1
2018 · Ecology and Evolution · Applied Ecology & Evolution · Global Change
Ecology and Evolution (EY) 2018

El Niño Southern Oscillation (ENSO) events have occurred approximately every 3-7 years over the last century. The cause of these ENSO events is related to

Open complete paper
2
2019 · Ecology and Evolution · Applied Ecology & Evolution · Global Change
Ecology and Evolution (EY) 2019

Which of the following crops should show the LOWEST proportional increase in photosynthetic rate under rising carbon dioxide levels in the atmosphere?

Open complete paper
3
2019 · Ecology and Evolution · Applied Ecology & Evolution · Global Change
Ecology and Evolution (EY) 2019

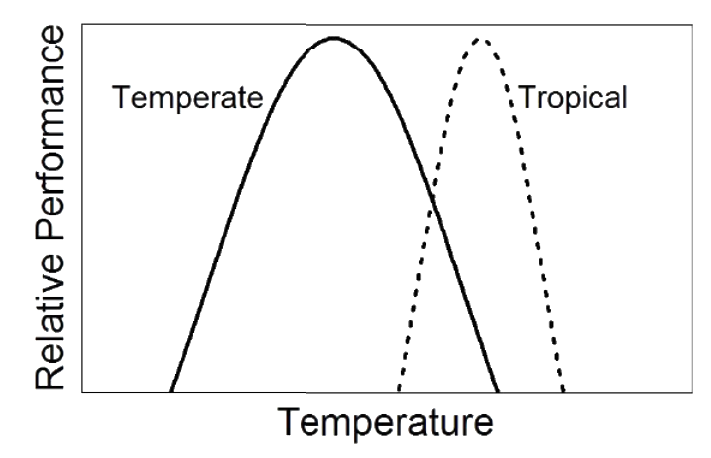
The relative performance of amphibians adapted to tropical (dashed line) and temperate (solid line) climates as a function of temperature is shown below. Assume that global warming will result in an equal increase in mean temperatures over the next 30 years in both regions. Which of the following statements about the effects of global warming on these two amphibians is most likely?

Question diagram

Open complete paper
4
2019 · Ecology and Evolution · Applied Ecology & Evolution · Global Change
Ecology and Evolution (EY) 2019
Global warming potential of different greenhouse gases (CO2, CH4, N2O, etc) is determined by their:
P: ability to absorb infrared radiation
Q: concentration in the atmosphere
R: residence time in the atmosphere
S: source of origin (whether natural, or anthropogenic)
Open complete paper
5
2020 · Ecology and Evolution · Applied Ecology & Evolution · Global Change
Ecology and Evolution (EY) 2020
In the last 3 to 4 decades, the average CO2 concentration in the Earth’s atmosphere has increased from ______.
Open complete paper
6
2021 · Ecology and Evolution · Applied Ecology & Evolution · Global Change
Ecology and Evolution (EY) 2021
The graph below shows how the lower limits of the elevational ranges of bird species on a tropical mountain have changed over 20 years (2000 to 2020) because of climate change. Each point below represents a bird species. Points would cluster on the dashed line if species had the same lower elevational range limits in 2000 and 2020. Given that the mountain summit is at an elevation of 3500 m (solid horizontal line), and assuming that the trend shown by the graph continues over the next 20 years, what would you expect in 2040?

Question diagram

Open complete paper
7
2024 · Ecology and Evolution · Applied Ecology & Evolution · Global Change
Ecology and Evolution (EY) 2024
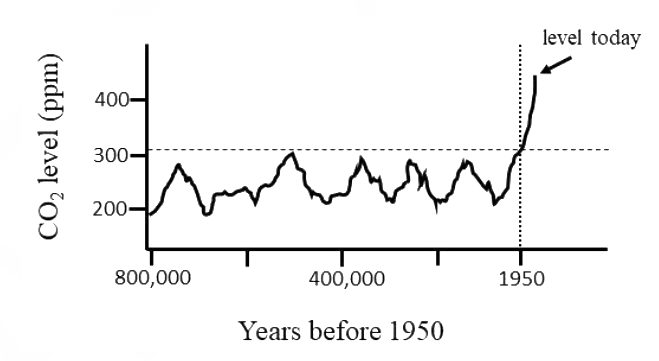
The figure shows the time-series of atmospheric CO₂ concentration on Earth (graph not-to-scale).

Which one of the factors given is the primary reason for the sudden increase in atmospheric CO₂ concentration after 1950?

Question diagram

Open complete paper
8
2024 · Ecology and Evolution · Applied Ecology & Evolution · Global Change
Ecology and Evolution (EY) 2024

Which one or more of the following is/are greenhouse gas(es)?

Open complete paper
9
2025 · Ecology and Evolution · Applied Ecology & Evolution · Global Change
Ecology and Evolution (EY) 2025

Mean global temperature since pre-industrial times has increased approximately by

Open complete paper
10
2025 · Ecology and Evolution · Applied Ecology & Evolution · Global Change
Ecology and Evolution (EY) 2025

Which one or more of the following processes has/have resulted in increased greenhouse gases in the atmosphere over the last 100 years?

Open complete paper
11
2016 · Ecology and Evolution · Applied Ecology & Evolution · Global Change
Ecology and Evolution (EY) 2016
Dichlorodiphenyltrichloroethane is related to the phenomenon of:
Open complete paper
12
2016 · Ecology and Evolution · Applied Ecology & Evolution · Global Change
Ecology and Evolution (EY) 2016
Sex is determined by temperature in many reptiles, including crocodiles and turtles. While lower temperatures produce males in turtles, the pattern is the opposite in crocodiles. Due to climate change, there is an increase in temperatures which results in a change in sex ratios. In small populations, this change in demography is likely to negatively impact the population growth of:
Open complete paper
13
2016 · Ecology and Evolution · Applied Ecology & Evolution · Global Change
Ecology and Evolution (EY) 2016
The relative abundance of C3 relative to C4 plant species increases with latitude because of the associated temperature gradient. A study in North America found that at 42° North, C3 plants become more abundant than C4 plants. Given an increase in mean global temperatures by 10°C and no other changes in environmental conditions, the latitude at which C3 plants become more abundant:
Open complete paper
14
2016 · Ecology and Evolution · Applied Ecology & Evolution · Global Change
Ecology and Evolution (EY) 2016
Ozone layer depletion, since the 1970s, is primarily attributed to:
Open complete paper
15
2022 · Ecology and Evolution · Applied Ecology & Evolution · Global Change
Ecology and Evolution (EY) 2022

Which one of the following is not an expected impact of global warming?

Open complete paper
16
2023 · Ecology and Evolution · Applied Ecology & Evolution · Global Change
Ecology and Evolution (EY) 2023
The increase in mean global temperature since the industrial revolution falls in the range of
Open complete paper
17
2023 · Ecology and Evolution · Applied Ecology & Evolution · Global Change
Ecology and Evolution (EY) 2023
Which one or more of the following processes contribute(s) substantially to increased mean global temperatures?
Open complete paper