More than type cumulative frequency distribution.Solution:(i)Less than type cumulative frequency distribution of the data is given below.
| (i) Less than type |
| Age (in year) |
Number of patients |
| Less than 10 |
0 |
| Less than 20 |
60 + 0 = 60 |
| Less than 30 |
60 + 42 = 102 |
| Less than 40 |
102 + 55 = 157 |
| Less than 50 |
157 + 70 = 227 |
| Less than 60 |
227 + 53 = 280 |
| Less than 70 |
280 + 20 =300 |
(ii)
More than type cumulative frequency distribution of the data is given below.
| (i) More than type |
| Age (in year) |
Number of patients |
| More than or equals 10 |
60 + 42 + 55 + 70 + 53 + 20 = 300 |
| More than or equals 20 |
42 + 55 + 70 + 53 + 20 = 240 |
| More than or equals 30 |
55 + 70 + 53 + 20 = 198 |
| More than or equals 40 |
70 + 53 + 20 = 143 |
| More than or equals 50 |
53 + 20 = 73 |
| More than or equals 60 |
20 |
| More than or equals 70 |
0 |
14. Given below is a cumulative frequency distribution showing the marks secured by 50 students of a class:
Marks Below 20 Below 40 Below 60 Below 80 Below 100
Number of students 17 22 29 37 50
Form the frequency distribution table for the data.
Solution:
The frequency distribution table for given data.
| Marks |
Number of students |
| 0 – 20 |
12 |
| 20 – 40 |
22 – 17 = 5 |
| 40 – 60 |
29 – 22 = 7 |
| 60 – 80 |
37 – 29 = 8 |
| 80 – 100 |
50 – 37 = 13 |
15. Weekly income of 600 families is tabulated below :
Weekly income Number of families
(in Rs)
0-1000 250
1000-2000 190
2000-3000 100
3000-4000 40
4000-5000 15
5000-6000 5
Total 600
Compute the median income.
Solution:
| Weekly Income |
Number of families (fi) |
Cumulative frequency (cf) |
| 0-1000 |
250 |
250 |
| 1000-2000 |
190 |
250 + 190 = 400 |
| 2000-3000 |
100 |
440 + 100 = 540 |
| 3000-4000 |
40 |
540 + 40 = 580 |
| 4000-5000 |
15 |
580 + 15 = 595 |
| 5000-6000 |
5 |
595 + 5 = 600 |
According to the question,
n = 600
∴ n/2 = 600/2 = 300
Cumulative frequency 440 lies in the interval 1000 – 2000.
Hence, lower median class, l = 1000
f = 190,
cf = 250,
Class width, h = 1000
And total observation n = 600
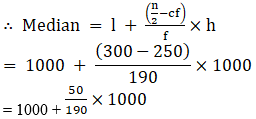
= 1000 + 5000/19
= 1000 + 263.15 = 1263.15
Hence, the median income is Rs.1263.15.
16. The maximum bowling speeds, in km per hour, of 33 players at a cricket coaching centre are given as follows:
Speed (km/h) 85-100 100-115 115-130 130-145
Number of players 11 9 8 5
Calculate the median bowling speed.
Solution:
First we construct the cumulative frequency table
| Speed ( in km/h) |
Number of players |
Cumulative frequency |
| 85 – 100 |
11 |
11 |
| 100 – 115 |
9 |
11 + 9 = 20 |
| 115 – 130 |
8 |
20 + 8 = 28 |
| 130 – 145 |
5 |
28 + 5 = 33 |
It is given that, n = 33
∴ n/2 = 33/2 = 16.5
Hence, the median class is 100 – 115.
Where, lower limit(l) = 100
Frequency (f) = 9
Cumulative frequency (cf) = 11
And class width(h) = 15
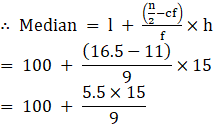
= 100 + 82.5/9
= 100 + 9.17
= 109.17
Hence, the median bowling speed is 109.17 km/h.
17. The monthly income of 100 families are given as below :
Income (in Rs) Number of families
0-5000 8
5000-10000 26
10000-15000 41
15000-20000 16
20000-25000 3
25000-30000 3
30000-35000 2
35000-40000 1
Calculate the modal income.
Solution:
According to the data given,
The highest frequency = 41,
41 lies in the interval 10000 – 15000.
Here, l = 10000, fm = 41,f1 = 26,f2 = 16 and h = 5000
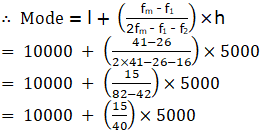
= 10000 + 15×125
= 10000 + 1875
= 11875
Hence, the modal income = Rs.11875 per month.
18. The weight of coffee in 70 packets are shown in the following table :
Weight (in g) Number of packets
200-201 12
201-202 26
202-203 20
203-204 9
204-205 2
205-206 1
Determine the modal weight.
Solution:
In the given data, the highest frequency is 26, which lies in the interval 201 – 202
Here, l = 201,fm = 26,f1 = 12,f2 = 20 and (class width) h = 1
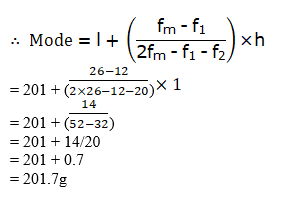
Hence, the modal weight = 201.7 g.
19. Two dice are thrown at the same time. Find the probability of getting
ASame number on both dice.
Different numbers on both dice.
Solution:
Two dice are thrown at the same time.
So, total number of possible outcomes = 36
(i) Same number on both dice.
Possible outcomes = (1,1), (2,2), (3, 3), (4, 4), (5, 5), (6, 6).
Hence, number of possible outcomes = 6
Therefore, the probability of getting same number on both dice = 6/36 = 1/6
(ii) Different number on both dice.
Hence, number of possible outcomes
= 36 – Number of possible outcomes for same number on both dice
= 36 – 6 = 30
Therefore, the probability of getting different number on both dice = 30/36 = 5/6
20. Two dice are thrown simultaneously. What is the probability that the sum of the numbers appearing on the dice is
(i) 7? (ii) a prime number? (iii) 1?
Solution:
According to the question,
Two dice are thrown simultaneously.
So, that number of possible outcomes = 36
(i) Sum of the numbers appearing on the dice is 7.
So, the possible outcomes = (1, 6), (2,5), (3, 4), (4, 3), (5, 2), (6, 1).
Hence, number of possible outcomes = 6
∴ the probability that the sum of the numbers appearing on the dice is 7 = 6/36 = 1/6
(ii) Sum of the numbers appearing on the dice is a prime number i.e., 2, 3, 5, 7 and 11.
So, the possible outcomes are (1, 1), (1,2), (2, 1), (1, 4), (2, 3), (3, 2), (4, 1), (1, 6), (2, 5), (3, 4), (4, 3), (5, 2), (6, 1), (5, 6) = (6, 5).
Hence, number of possible outcomes = 15
∴ the probability that the sum of the numbers appearing on the dice is a prime number = 15/36 = 5/12
(iii) Sum of the numbers appearing on the dice is 1.
It is not possible, so its probability is zero.
∴ the probability that the sum of the numbers appearing on the dice is 1 = 0
21. Two dice are thrown together. Find the probability that the product of the numbers on the top of the dice is
(i) 6 (ii) 12 (iii) 7
Solution:
Number of total outcomes = 36
(i) When product of the numbers on the top of the dice = 6.
The possible outcomes = (1, 6), (2,3), (3, 2), (6, 1).
Hence, number of possible ways = 4
∴ Probability that the product of the numbers on the top of the dice is 6= 4/36 = 1/9
(ii) When product of the numbers on the top of the dice = 12.
The possible ways are (2, 6), (3,4), (4, 3), (6, 2).
Hence, number of possible ways = 4
∴ Probability that the product of the numbers on the top of the dice is 12= 4/36 = 1/9
(iii) Product of the numbers on the top of the dice cannot be 7.
Hence, the probability is zero.
∴ Probability that the product of the numbers on the top of the dice is 7 = 0
To facilitate easy learning and aid students in understanding the chapter better, free NCERT Exemplar for Class 10 Maths Chapter 13 is provided. This can be downloaded in the form of a PDF. Students can also download other sources of learning from BYJU’S, such as notes, exemplar books, NCERT Maths Solutions for Class 10 and question papers, to prepare for their exams to score good marks. Solving sample papers and previous years’ question papers also gives an idea of question types asked in the board exam from Chapter 13 Statistics and Probability.
Download BYJU’S – The Learning App and get personalised video lessons explaining different types of Maths topics such as statistics, probability, etc. At BYJU’S, you can experience a new way of learning to understand concepts easily. Also, get Maths Exemplar Solutions for 10th standard chapters here.