My Cart
Your Cart 0

    Your cart is empty.

  • Total (Amount) ₹0.00
NCERT Exemplar · Class 10 · Maths

Chapter 13: Statistics and Probability

Practice each question, then open the answer or worked solution.

Exercise 13.3

13 questions
Q1Written answer

Find the mean of the distribution :

Class 1-3 3-5 5-7 7-10

Frequency 9 22 27 17

Show solutionHide solution
Worked solution

We first, find the class mark xi of each class and then proceed as follows.

Class Class Marks (xi) Frequency (fi) fixi
1-3 2 9 18
3-5 4 22 88
5-7 6 27 162
7-10 8.5 17 144.5
Σfi = 75 Σfixi = 412.5

Mean,

NCERT Exemplar Class 10 Maths Chapter 13 Ex. 13.3 Question 1

Therefore, mean of the given distribution = 5.5.

Q2Written answer

Calculate the mean of the scores of 20 students in a mathematics test :

Marks 10-20 20-30 30-40 40-50 50-60

Number of students 2 4 7 6 1

Show solutionHide solution
Worked solution

We first, find the class mark xi of each class and then proceed as follows

Class Class Marks (xi) Frequency (fi) fixi
10-20 15 2 30
20-30 25 4 100
30-40 35 7 245
40-50 45 6 270
50-60 55 1 55
Σfi = 20 Σfixi = 700

Mean,

NCERT Exemplar Class 10 Maths Chapter 13 Ex. 13.3 Question 2

Therefore, mean of scores of 20 students in mathematics test = 35.

Q3Written answer

Calculate the mean of the following data :

Class 4 – 7 8 –11 12– 15 16 –19

Frequency 5 4 9 10

Show solutionHide solution
Worked solution

The given data is not continuous.

So, we subtract 0.5 from the lower limit and add 0.5 in the upper limit of each class.

Class Class Marks (xi) Frequency (fi) fixi
3.5 – 7.5 5.5 5 27.5
7.5 – 11.5 9.5 4 38
11.5 – 15.5 13.5 9 121.5
15.5 – 19.5 17.5 10 175
Σfi = 28 Σfixi = 362


Mean,

NCERT Exemplar Class 10 Maths Chapter 13 Ex. 13.3 Question 3

Therefore, mean of the given data = 12.93.

Q4Written answer

The following table gives the number of pages written by Sarika for completing her own book for 30 days :

Number of pages written per day 16-18 19-21 22-24 25-27 28-30

Number of days 1 3 4 9 13

Find the mean number of pages written per day.

Show solutionHide solution
Worked solution
Class Marks Mid – Value (xi) Number of days (fi) fixi
15.5 – 18.5 17 1 17
18.5 – 21.5 20 3 60
21.5 – 24.5 23 4 92
24.5 – 27.5 26 9 234
27.5 – 30.5 29 13 377
Σfi = 30 Σfixi = 780

The given data is not continuous.

Hence, we subtract 0.5 from the lower limit and add 0.5 in the upper limit of each class.

NCERT Exemplar Class 10 Maths Chapter 13 Ex. 13.3 Question 4

Therefore, the mean of pages written per day = 26.

Q5Written answer

The daily income of a sample of 50 employees are tabulated as follows :

Income (in Rs) 1-200 201-400 401-600 601-800

Number of employees 14 15 14 7

Find the mean daily income of employees.

Show solutionHide solution
Worked solution
C.I xi di = (xi – a) Fi fidi
1 – 200 100.5 – 200 14 – 2800
201 – 400 300.5 0 15 0
401 – 600 500.5 200 15 2800
601 – 800 700.5 400 7 2800
Σfi = 50 Σfixi = 2800

∴ Assumed mean, a = 300.5 and di = (xi – a)

NCERT Exemplar Class 10 Maths Chapter 13 Ex. 13.3 Question 5

= 300.5 + 2800/50

= 356.5

Hence, the average daily income of employees = Rs.356.5

Q6Written answer

An aircraft has 120 passenger seats. The number of seats occupied during 100 flights is given in the following table :

Number of seats 100-104 104-108 108-112 112-116 116-120

Frequency 15 20 32 18 15

Determine the mean number of seats occupied over the flights.

Show solutionHide solution
Worked solution
Class Interval Class Marks (xi) Frequency (fi) Deviation (di = xi – a) fidi
100 – 104 102 15 – 8 – 120
104 – 108 106 20 – 4 – 80
108 – 112 110 32 0 0
112 – 116 114 18 4 72
116 – 120 118 15 8 120
N = Σfi = 100 Σfidi = – 8

∴ Assumed mean, a = 110

Class width, h = 4

And total observations, N = 100

Hence, finding mean,

NCERT Exemplar Class 10 Maths Chapter 13 Ex. 13.3 Question 6

= 110 + (-8/100)

= 110 – 0.08

= 109.92

But we know that the seats cannot be in decimal.

Therefore, the number of seats = 109.

Q7Written answer

The weights (in kg) of 50 wrestlers are recorded in the following table :

Weight (in kg) 100-110 110-120 120-130 130-140 140-150
Number of wrestlers 4 14 21 8 3

Find the mean weight of the wrestlers.

Show solutionHide solution
Worked solution
Weight (in kg) Number of Wrestlers (fi) Class Marks (xi) Deviation

(di = xi – a)

fidi
100 – 110 4 105 – 20 – 80
110 – 120 14 115 – 10 – 140
120 – 130 21 125 0 0
130 – 140 8 135 10 80
140 – 150 3 145 20 60
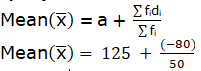
N = Σfi = 50 Σfidi = – 80

∴ Assumed mean, (a) = 125

Class width, (h) = 10

and total observations, (N) = 50

By step deviation method,

NCERT Exemplar Class 10 Maths Chapter 13 Ex. 13.3 Question 7

= 125 – 16

= 123.4kg

Hence, mean weight of wrestlers = 123.4kg

Q8Written answer

The mileage (km per litre) of 50 cars of the same model was tested by a manufacturer and details are tabulated as given below :

Mileage (km/l) 10-12 12-14 14-16 16-18

Number of cars 7 12 18 13

Find the mean mileage.

The manufacturer claimed that the mileage of the model was 16 km/litre. Do you agree with this claim?

Show solutionHide solution
Worked solution
Mileage (km L-1) Class –Marks (xi) Number of cars (fi) fixi
10 – 12 11 7 77
12 – 14 13 12 156
14 – 16 15 18 270
16 – 18 17 13 221
Total Σfi = 50 Σfixi = 724

Here, Σfi = 50

Σfixi = 724

NCERT Exemplar Class 10 Maths Chapter 13 Ex. 13.3 Question 8

= 724/50 = 14.48

Hence, mean mileage = 14.48 km/h

No, I don’t agree with the claim because the manufacturer is claiming mileage 1.52 km/h more than average mileage.

Q9Written answer

The following is the distribution of weights (in kg) of 40 persons :

Weight (in kg) 40-45 45-50 50-55 55-60 60-65 65-70 70-75 75-80

Number of persons 4 4 13 5 6 5 2 1

Construct a cumulative frequency distribution (of the less than type) table for the data above.

Show solutionHide solution
Worked solution
Weight (in kg) Cumulative frequency
Less than 45 4
Less than 50 4 + 4 = 8
Less than 55 8 + 13 = 21
Less than 60 21 + 5 = 26
Less than 65 26 + 6 = 32
Less than 70 32 + 5 = 37
Less than 75 37 + 2 = 39
Less than 80 39 + 1 = 40
Q10Written answer

The following table shows the cumulative frequency distribution of marks of 800 students in an examination:

Marks Number of students

Below 10 10

Below 20 50

Below 30 130

Below 40 270

Below 50 440

Below 60 570

Below 70 670

Below 80 740

Below 90 780

Below 100 800

Construct a frequency distribution table for the data above.

Show solutionHide solution
Worked solution

The frequency distribution table for the given data is:

Class Interval Number of students
0-10 10
10-20 50 – 10 = 40
20-30 130 – 50 = 80
30-40 270 – 130 = 140
40-50 440 – 270 = 170
50-60 570 – 440 = 130
60-70 670 – 570 = 100
70-80 740 – 670 = 70
80-90 780 – 740 = 40
90-100
  1. – 780 = 20