My Cart
Your Cart 0

    Your cart is empty.

  • Total (Amount) ₹0.00
Previous year question hub

Data Interpretation - General Aptitude (GA) Previous Year Questions

Practice Data Interpretation - General Aptitude (GA) previous year questions organised from real papers, with year-wise coverage and clear topic navigation.

5Papers
5Years
5Questions
1Topics

Data Interpretation question pattern

Every graph below is calculated only from this selection.

Questions by year

Year-wise coverage for Data Interpretation. Each bar uses a separate theme-derived color.

Difficulty distribution

How the classified questions are distributed by difficulty.

Medium 4 80%
Easy 1 20%

Question type distribution

MCQ, numerical, multiple-select and other formats found in these papers.

MCQ 5 100%

Subject weightage

Top subjects by unique question coverage.

General Aptitude (GA)
5 Qs

Most asked topics

Top topics across the included previous year papers.

Data Interpretation
5 Qs

Subtopic coverage

Top subtopics inside this exact selection.

Elementary Statistics
5 Qs

Paper coverage

Question coverage for the most populated papers. Every active PYP paper remains listed below.

Statistics (ST) 2025
1 Qs
Statistics (ST) 2024
1 Qs
Statistics (ST) 2023
1 Qs
Statistics (ST) 2021
1 Qs
Statistics (ST) 2019
1 Qs

Browse by subtopics

Open a focused page built from the same verified paper data.

Included previous year papers

Newest papers appear first. Sort by year, question coverage or name.

PaperYear / sessionQuestions in this viewOpen
Statistics (ST) 202520251View paper
Statistics (ST) 202420241View paper
Statistics (ST) 202320231View paper
Statistics (ST) 202120211View paper
Statistics (ST) 201920191View paper

Sample previous year questions

A varied preview from the papers represented in this selection, with every available option.

1
2019 · General Aptitude (GA) · Data Interpretation · Elementary Statistics
Statistics (ST) 2019
In a country of 1400 million population, 70% own mobile phones. Among the mobile phone owners, only 294 million access the Internet. Among these Internet users, only half buy goods from e-commerce portals. What is the percentage of these buyers in the country?
Open complete paper
2
2021 · General Aptitude (GA) · Data Interpretation · Elementary Statistics
Statistics (ST) 2021
The number of minutes spent by two students, X and Y, exercising every day in a given week are shown in the bar chart above.
The number of days in the given week in which one of the students spent a minimum of 10% more than the other student, on a given day, is
Open complete paper
3
2023 · General Aptitude (GA) · Data Interpretation · Elementary Statistics
Statistics (ST) 2023
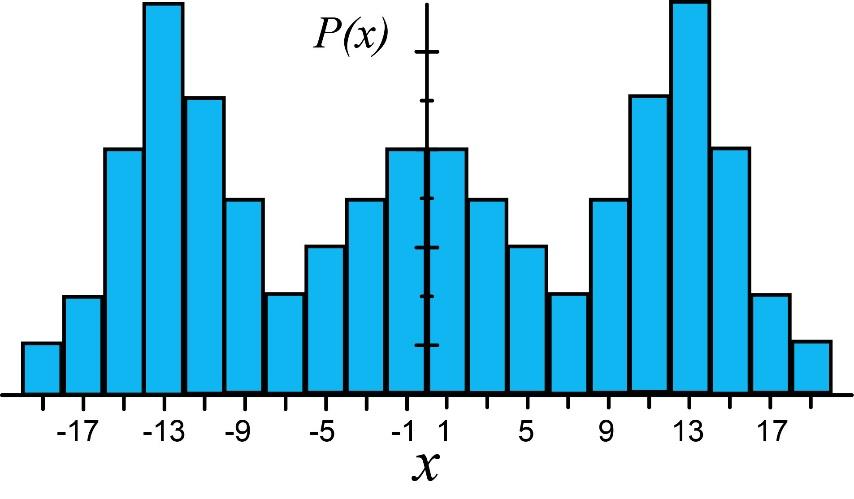
Which one of the options can be inferred about the mean, median, and mode for the given probability distribution (i.e. probability mass function), \(P(x)\), of a variable \(x\)?
Open complete paper
4
2024 · General Aptitude (GA) · Data Interpretation · Elementary Statistics
Statistics (ST) 2024
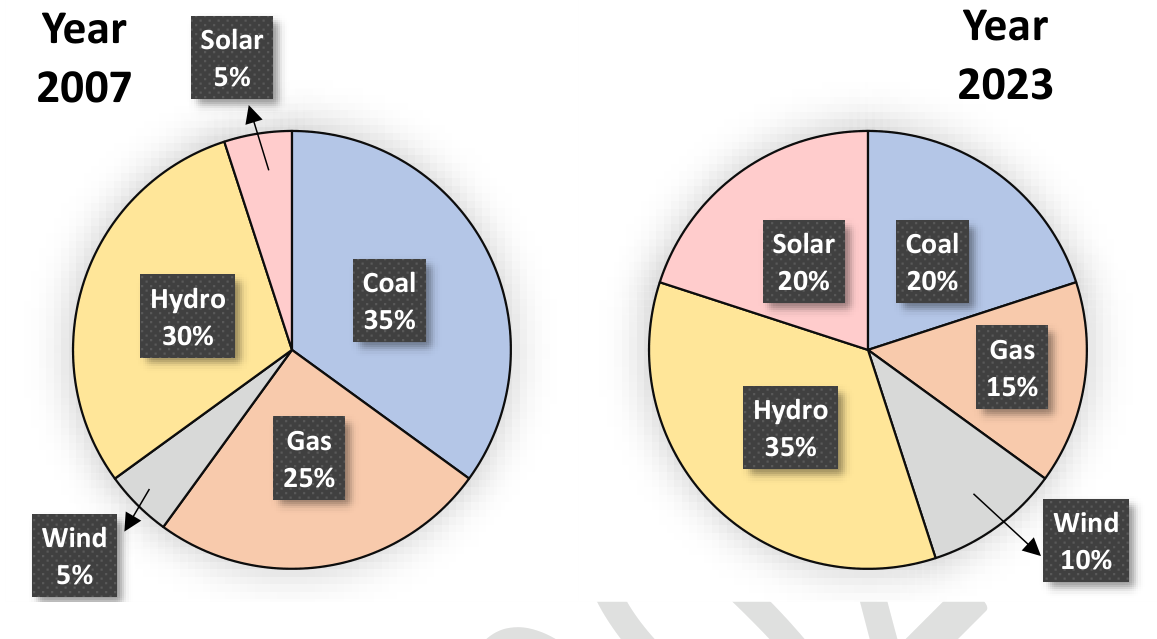
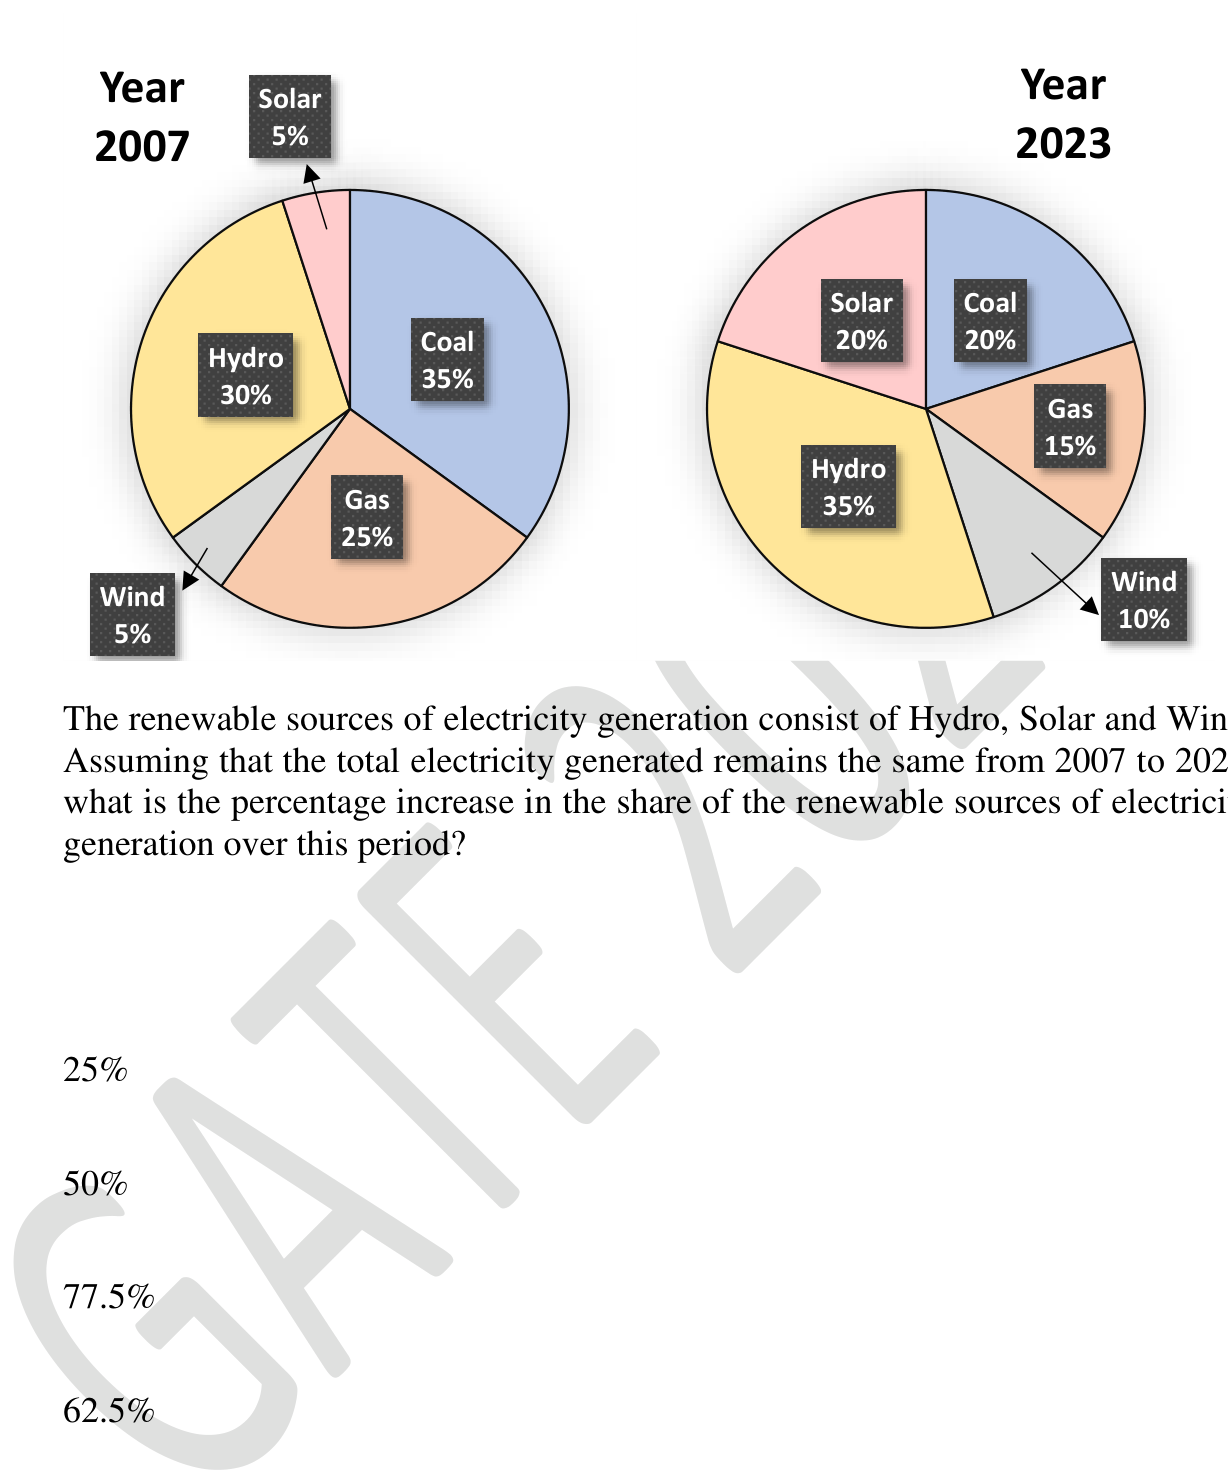
The pie charts depict the shares of various power generation technologies in the total electricity generation of a country for the years 2007 and 2023.
The renewable sources of electricity generation consist of Hydro, Solar and Wind. Assuming that the total electricity generated remains the same from 2007 to 2023, what is the percentage increase in the share of the renewable sources of electricity generation over this period?

Source question diagram

Source question diagram

Open complete paper
5
2025 · General Aptitude (GA) · Data Interpretation · Elementary Statistics
Statistics (ST) 2025
A bag contains Violet (V), Yellow (Y), Red (R), and Green (G) balls. On counting them, the following results are obtained:
(i) The sum of Yellow balls and twice the number of Violet balls is 50.
(ii) The sum of Violet and Green balls is 50.
(iii) The sum of Yellow and Red balls is 50.
(iv) The sum of Violet and twice the number of Red balls is 50.
Which one of the following Pie charts correctly represents the balls in the bag?
Open complete paper