My Cart
Your Cart 0

    Your cart is empty.

  • Total (Amount) ₹0.00
Previous year question hub

Elementary Statistics - Data Interpretation - General Aptitude (GA) Previous Year Questions

Practice Elementary Statistics - Data Interpretation - General Aptitude (GA) previous year questions organised from real papers, with year-wise coverage and clear topic navigation.

7Papers
7Years
10Questions
1Topics

Elementary Statistics question pattern

Every graph below is calculated only from this selection.

Questions by year

Year-wise coverage for Elementary Statistics. Each bar uses a separate theme-derived color.

Difficulty distribution

How the classified questions are distributed by difficulty.

Medium 5 50%
Easy 5 50%

Question type distribution

MCQ, numerical, multiple-select and other formats found in these papers.

MCQ 9 90%
Numerical Answer Type (NAT) 1 10%

Subject weightage

Top subjects by unique question coverage.

General Aptitude (GA)
10 Qs

Most asked topics

Top topics across the included previous year papers.

Data Interpretation
10 Qs

Subtopic coverage

Top subtopics inside this exact selection.

Elementary Statistics
10 Qs

Paper coverage

Question coverage for the most populated papers. Every active PYP paper remains listed below.

Production & Industrial Engineering (PI) 2025
2 Qs
Production & Industrial Engineering (PI) 2024
2 Qs
Production & Industrial Engineering (PI) 2021
1 Qs
Production & Industrial Engineering (PI) 2017
1 Qs
Production & Industrial Engineering (PI) 2016
1 Qs
Production & Industrial Engineering (PI) 2015
2 Qs
Production & Industrial Engineering (PI) 2014
1 Qs

Included previous year papers

Newest papers appear first. Sort by year, question coverage or name.

PaperYear / sessionQuestions in this viewOpen
Production & Industrial Engineering (PI) 202520252View paper
Production & Industrial Engineering (PI) 202420242View paper
Production & Industrial Engineering (PI) 202120211View paper
Production & Industrial Engineering (PI) 201720171View paper
Production & Industrial Engineering (PI) 201620161View paper
Production & Industrial Engineering (PI) 201520152View paper
Production & Industrial Engineering (PI) 201420141View paper

All Elementary Statistics previous year questions

Practice every matching question in batches of 20, with every available option.

1
2014 · General Aptitude (GA) · Data Interpretation · Elementary Statistics
Production & Industrial Engineering (PI) 2014
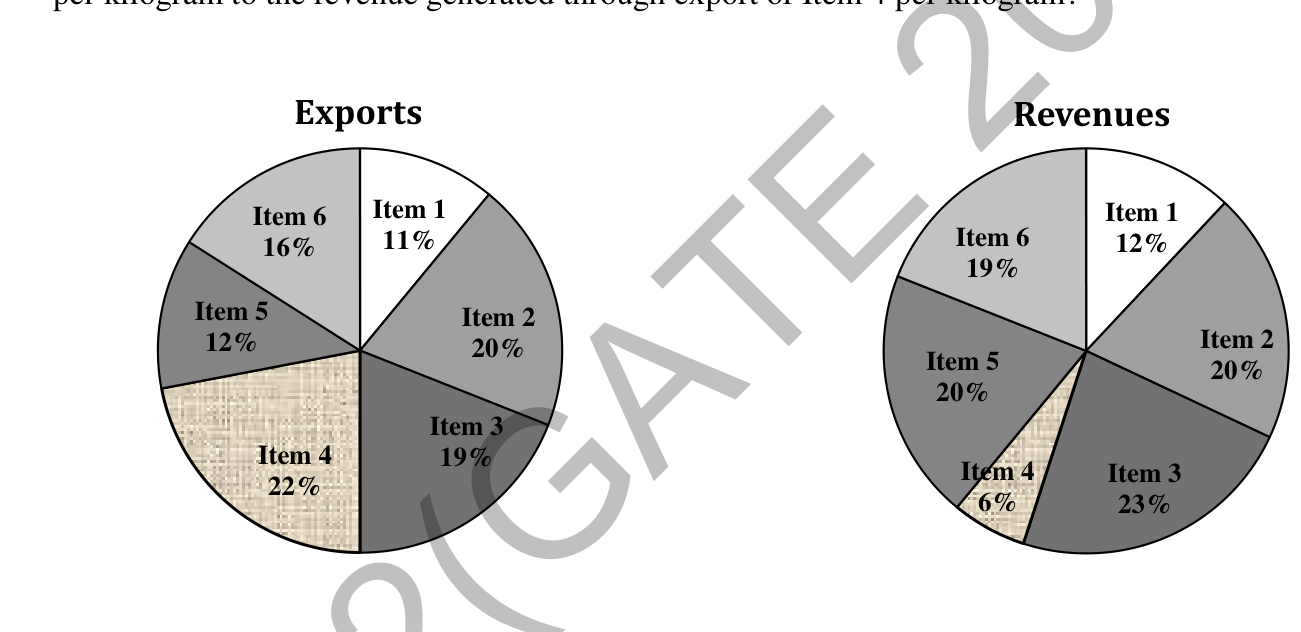
The total exports and revenues from the exports of a country are given in the two pie charts below. The pie chart for exports shows the quantity of each item as a percentage of the total quantity of exports. The pie chart for the revenues shows the percentage of the total revenue generated through export of each item. The total quantity of exports of all the items is 5 lakh tonnes and the total revenues are 250 crore rupees. What is the ratio of the revenue generated through export of Item 1 per kilogram to the revenue generated through export of Item 4 per kilogram?

Source question diagram

Open complete paper
2
2015 · General Aptitude (GA) · Data Interpretation · Elementary Statistics
Production & Industrial Engineering (PI) 2015
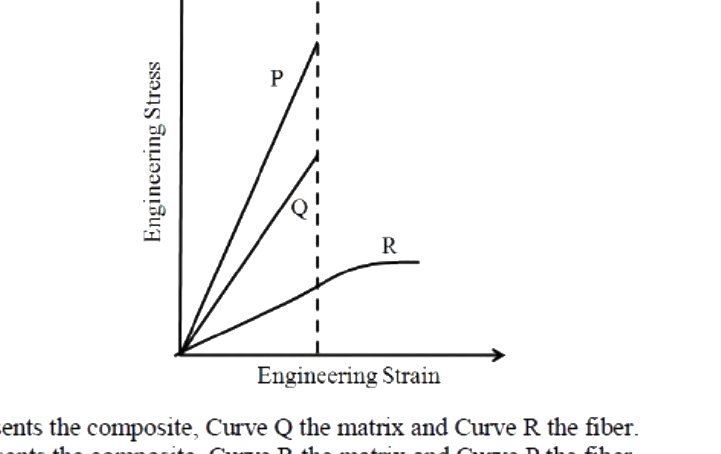
Consider a glass-fiber reinforced polymer material. The stress-strain curves of the fiber, matrix and composite are plotted in the figure. Which one of the following statements is TRUE?

Question diagram

Open complete paper
3
2015 · General Aptitude (GA) · Data Interpretation · Elementary Statistics
Production & Industrial Engineering (PI) 2015
In a manufacturing process, 24 samples each of size 50 items were inspected and a total of 52 defective items were observed. The lower and upper control limits set for the p-chart should, respectively, be
Open complete paper
4
2016 · General Aptitude (GA) · Data Interpretation · Elementary Statistics
Production & Industrial Engineering (PI) 2016
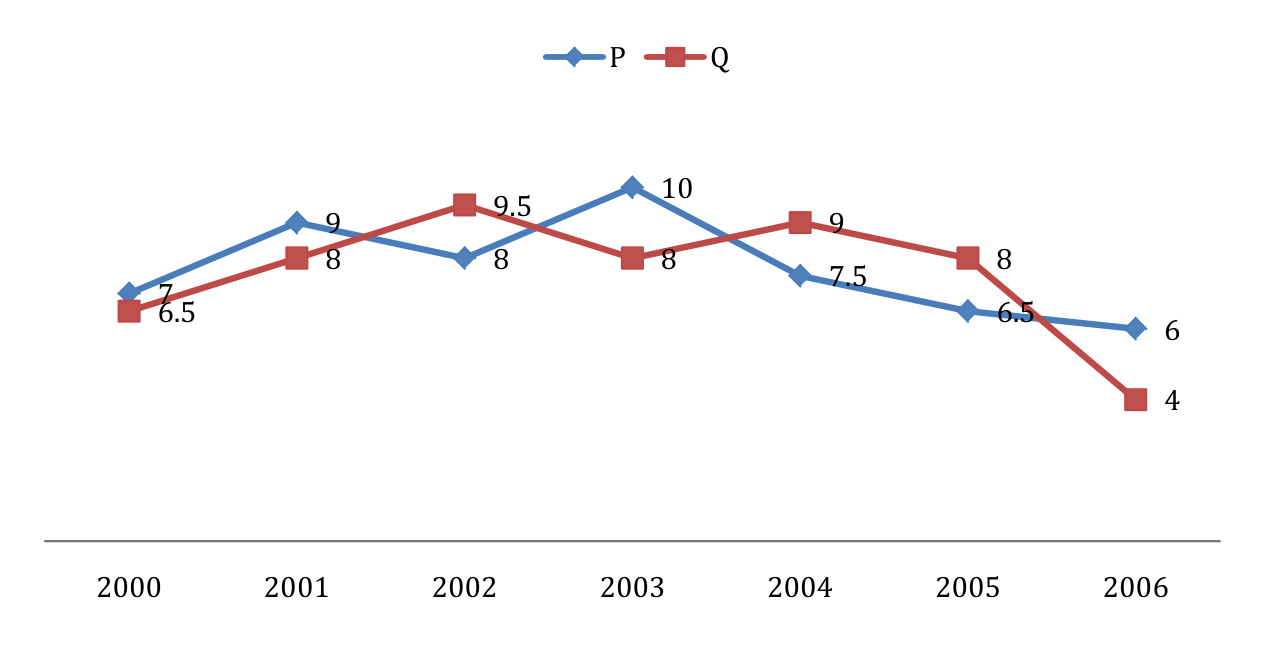
Two finance companies, P and Q, declared fixed annual rates of interest on the amounts invested with them. The rates of interest offered by these companies may differ from year to year. Year-wise annual rates of interest offered by these companies are shown by the line graph provided below.
If the amounts invested in the companies, P and Q, in 2006 are in the ratio 8:9, then the amounts received after one year as interests from companies P and Q would be in the ratio:

Source question diagram

Open complete paper
5
2017 · General Aptitude (GA) · Data Interpretation · Elementary Statistics
Production & Industrial Engineering (PI) 2017
40% of deaths on city roads may be attributed to drunken driving. The number of degrees needed to represent this as a slice of a pie chart is
Open complete paper
6
2021 · General Aptitude (GA) · Data Interpretation · Elementary Statistics
Production & Industrial Engineering (PI) 2021
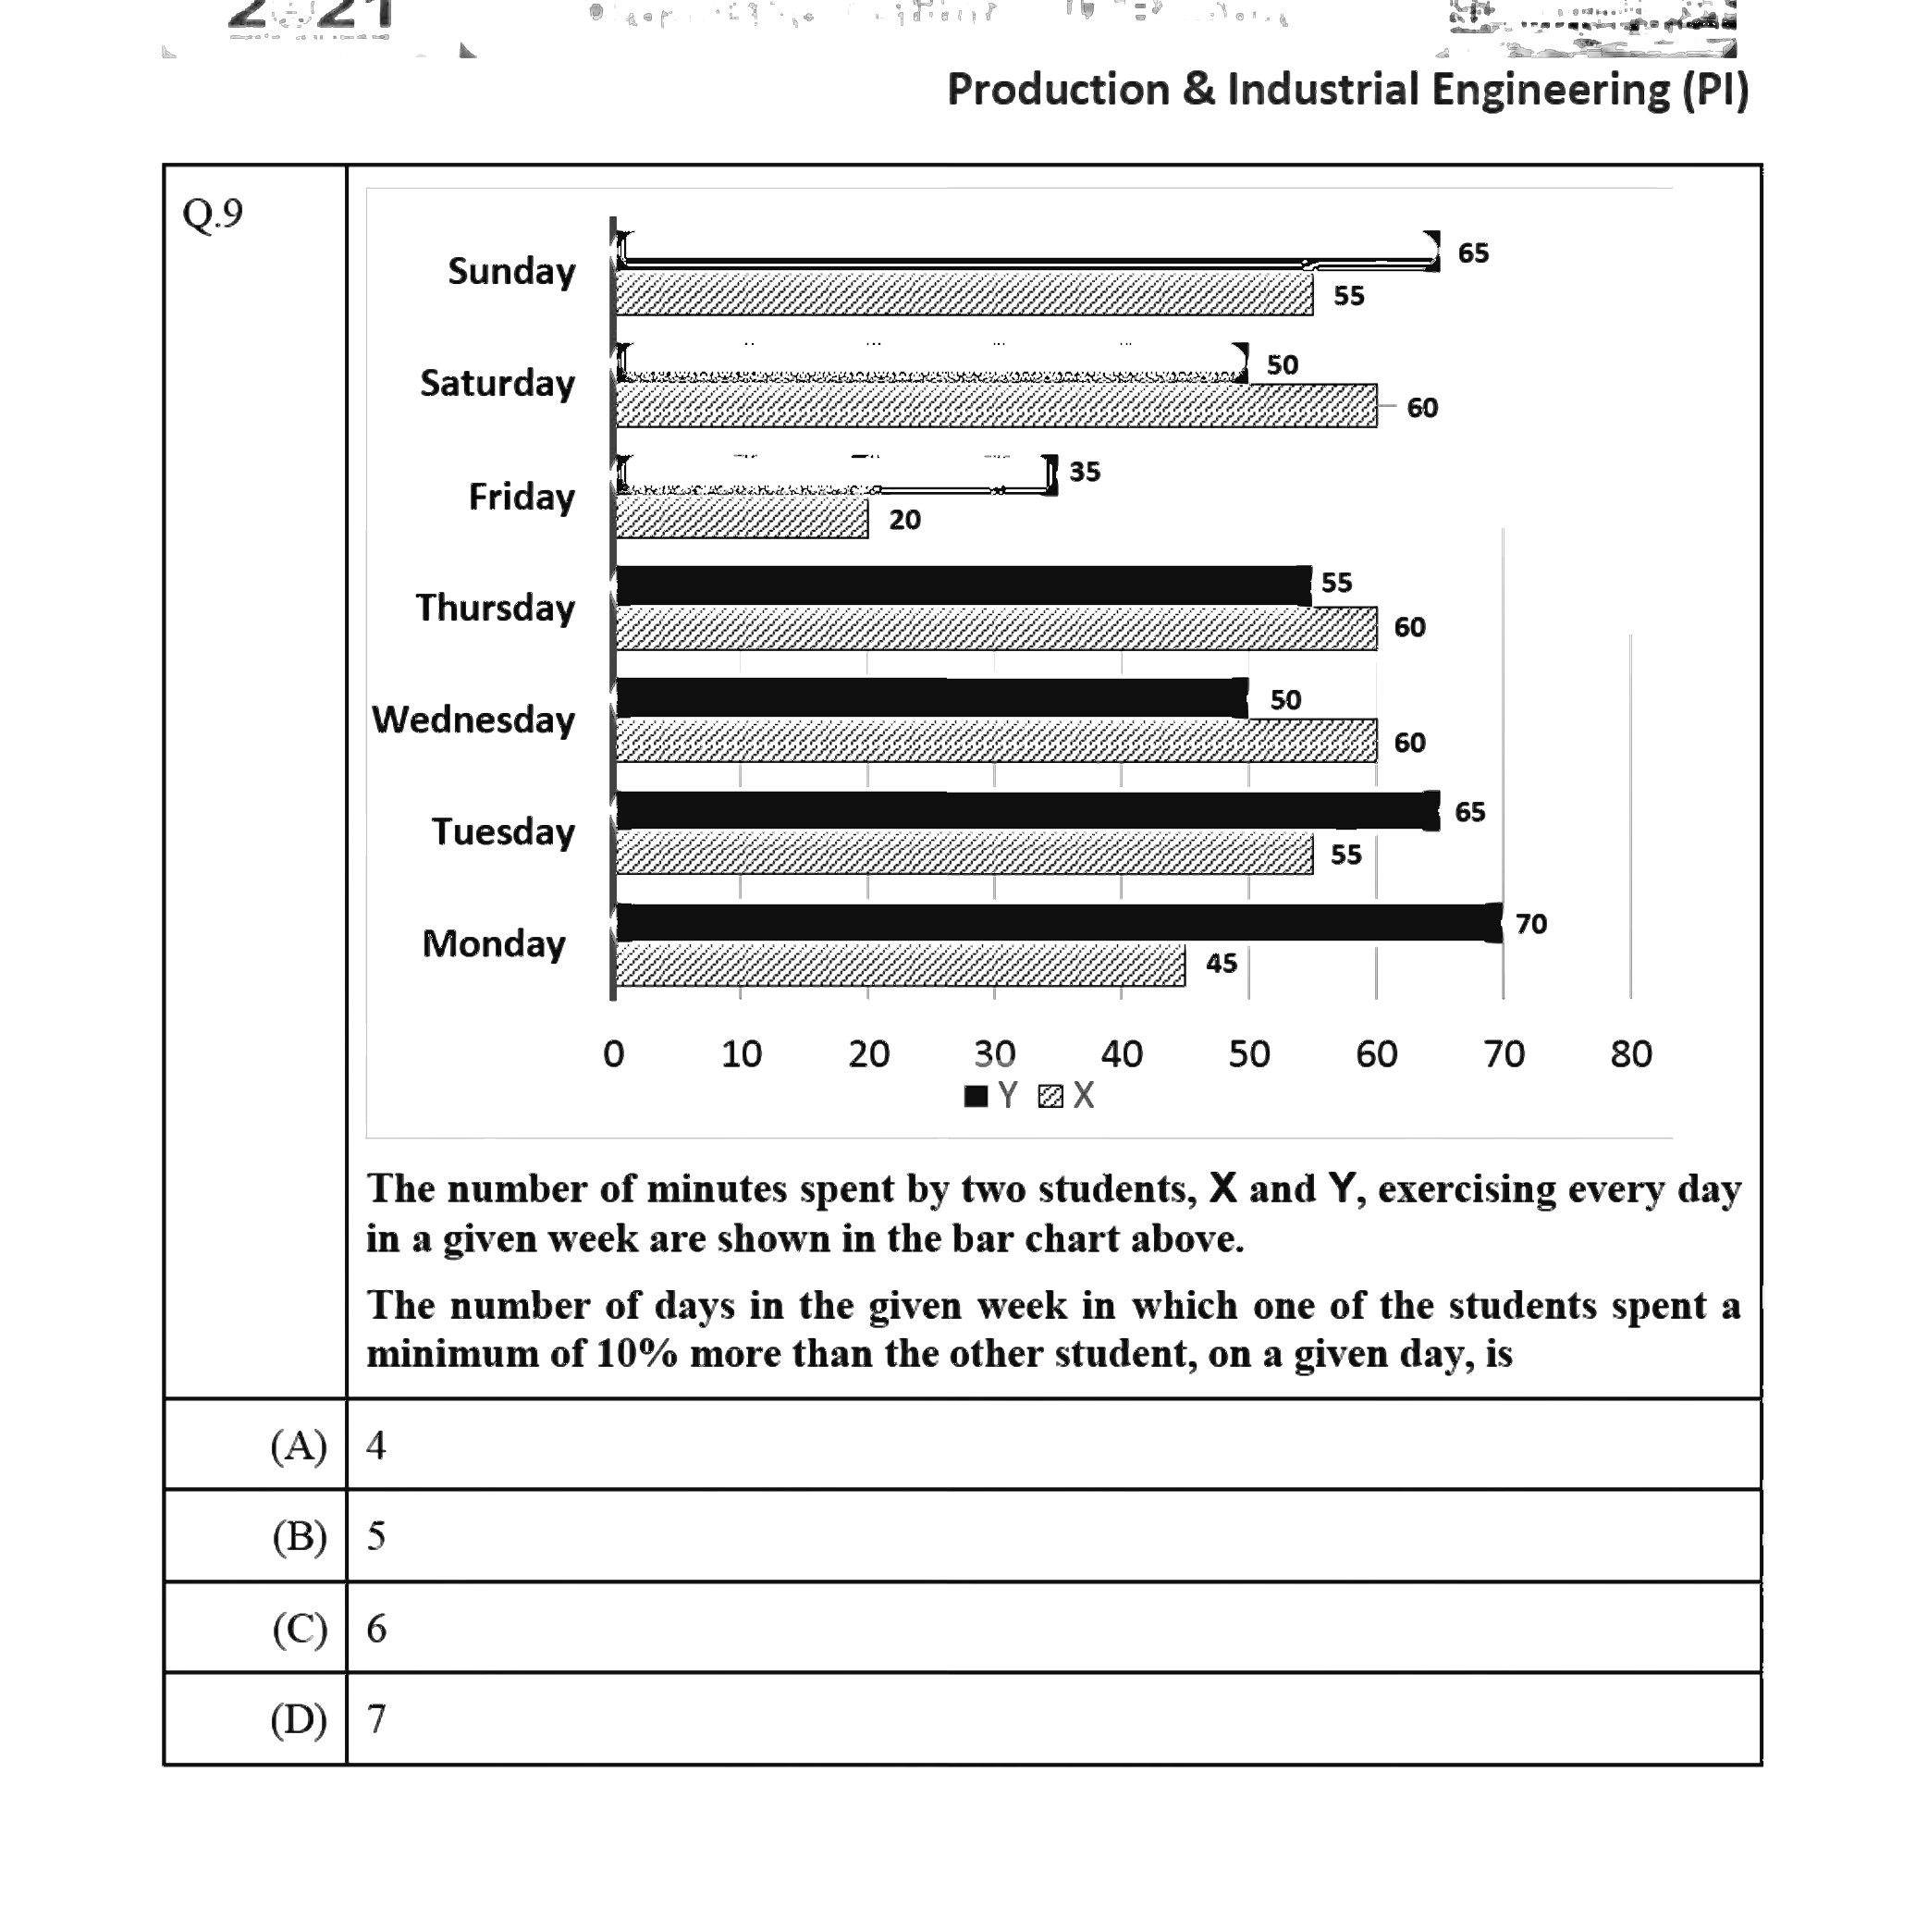
The number of minutes spent by two students, X and Y, exercising every day in a given week are shown in the bar chart above.
The number of days in the given week in which one of the students spent a minimum of 10% more than the other student, on a given day, is
Open complete paper
7
2024 · General Aptitude (GA) · Data Interpretation · Elementary Statistics
Production & Industrial Engineering (PI) 2024
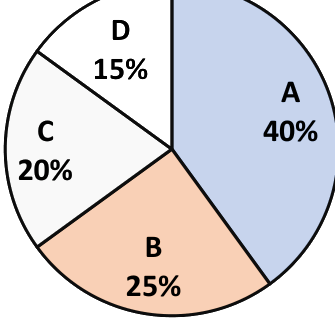
In an election, the share of valid votes received by the four candidates A, B, C, and D is represented by the pie chart shown. The total number of votes cast in the election were 1,15,000, out of which 5,000 were invalid.

Based on the data provided, the total number of valid votes received by the candidates B and C is

Question diagram

Open complete paper
8
2024 · General Aptitude (GA) · Data Interpretation · Elementary Statistics
Production & Industrial Engineering (PI) 2024
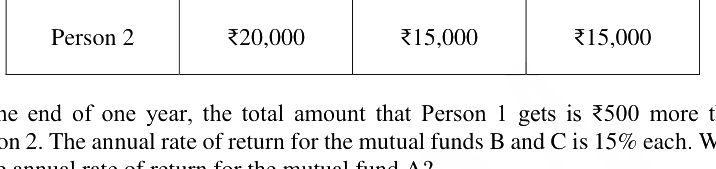
Person 1 and Person 2 invest in three mutual funds A, B, and C. The amounts they invest in each of these mutual funds are given in the table.
Mutual fund AMutual fund BMutual fund C
Person 1₹10,000₹20,000₹20,000
Person 2₹20,000₹15,000₹15,000
At the end of one year, the total amount that Person 1 gets is ₹500 more than Person 2. The annual rate of return for the mutual funds B and C is 15% each. What is the annual rate of return for the mutual fund A?

Question diagram

Open complete paper
9
2025 · General Aptitude (GA) · Data Interpretation · Elementary Statistics
Production & Industrial Engineering (PI) 2025
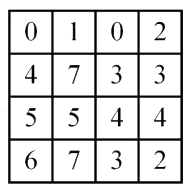
A 4 × 4 digital image has pixel intensities (U) as shown in the figure. The number of pixels with U ≤ 4 is:

Question diagram

Open complete paper
10
2025 · General Aptitude (GA) · Data Interpretation · Elementary Statistics
Production & Industrial Engineering (PI) 2025
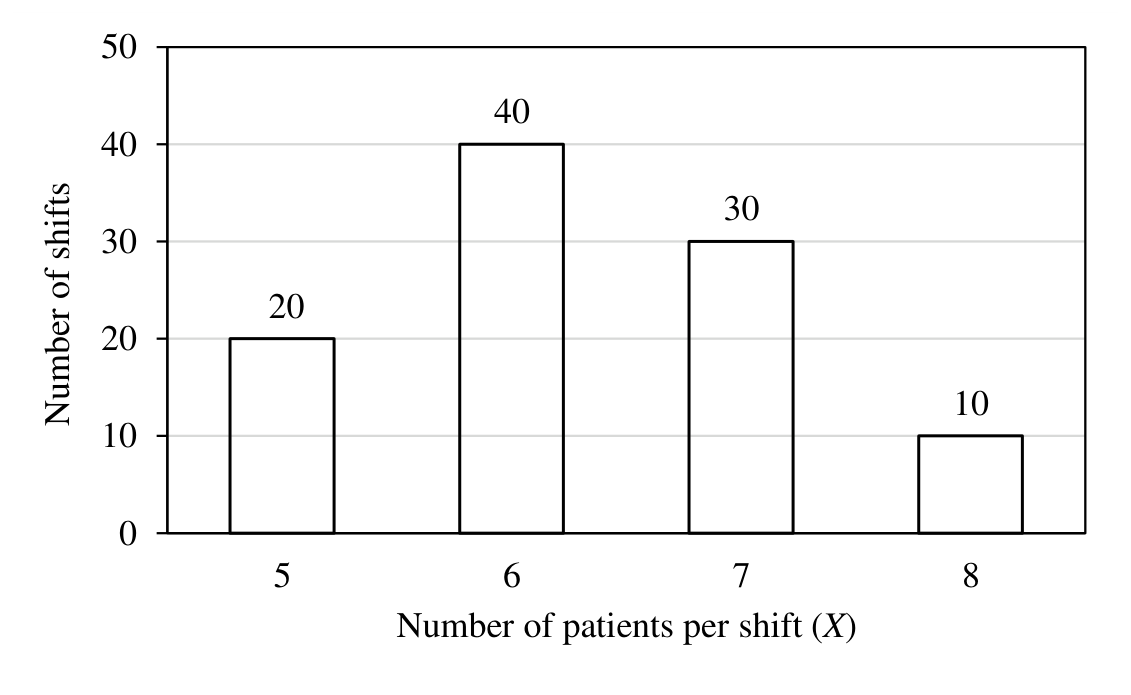
The number of patients per shift \(X\) consulting Dr. Gita in her past 100 shifts is shown in the figure. If the amount she earns is ₹ 1000\(X - 0.2\), what is the average amount (in ₹) she has earned per shift in the past 100 shifts?
Note: The figure shown is representative.

Source question diagram

Open complete paper