My Cart
Your Cart 0

    Your cart is empty.

  • Total (Amount) ₹0.00
Previous year question hub

Elementary Statistics - Data Interpretation - General Aptitude (GA) Previous Year Questions

Practice Elementary Statistics - Data Interpretation - General Aptitude (GA) previous year questions organised from real papers, with year-wise coverage and clear topic navigation.

7Papers
7Years
8Questions
1Topics

Elementary Statistics question pattern

Every graph below is calculated only from this selection.

Questions by year

Year-wise coverage for Elementary Statistics. Each bar uses a separate theme-derived color.

Difficulty distribution

How the classified questions are distributed by difficulty.

Medium 7 87.5%
Easy 1 12.5%

Question type distribution

MCQ, numerical, multiple-select and other formats found in these papers.

MCQ 8 100%

Subject weightage

Top subjects by unique question coverage.

General Aptitude (GA)
8 Qs

Most asked topics

Top topics across the included previous year papers.

Data Interpretation
8 Qs

Subtopic coverage

Top subtopics inside this exact selection.

Elementary Statistics
8 Qs

Paper coverage

Question coverage for the most populated papers. Every active PYP paper remains listed below.

Physics (PH) 2024
1 Qs
Physics (PH) 2022
1 Qs
Physics (PH) 2020
1 Qs
Physics (PH) 2018
2 Qs
Physics (PH) 2017
1 Qs
Physics (PH) 2016
1 Qs
Physics (PH) 2014
1 Qs

Included previous year papers

Newest papers appear first. Sort by year, question coverage or name.

PaperYear / sessionQuestions in this viewOpen
Physics (PH) 202420241View paper
Physics (PH) 202220221View paper
Physics (PH) 202020201View paper
Physics (PH) 201820182View paper
Physics (PH) 201720171View paper
Physics (PH) 201620161View paper
Physics (PH) 201420141View paper

All Elementary Statistics previous year questions

Practice every matching question in batches of 20, with every available option.

1
2014 · General Aptitude (GA) · Data Interpretation · Elementary Statistics
Physics (PH) 2014
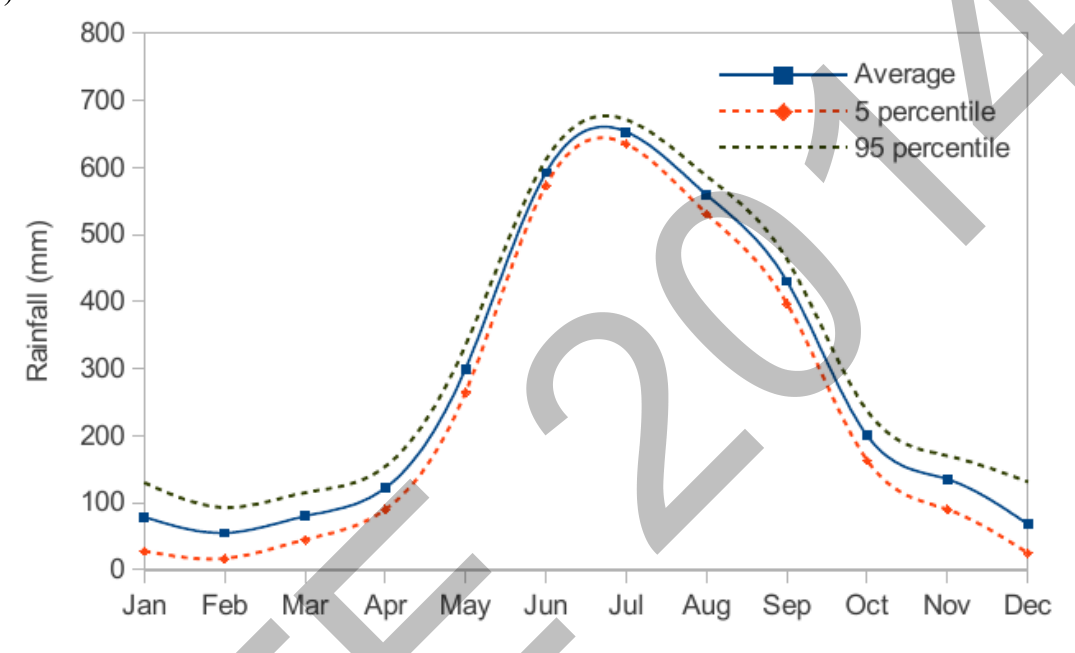
The monthly rainfall chart based on 50 years of rainfall in Agra is shown in the following figure. Which of the following are true? (k percentile is the value such that k percent of the data fall below that value)
(i) On average, it rains more in July than in December
(ii) Every year, the amount of rainfall in August is more than that in January
(iii) July rainfall can be estimated with better confidence than February rainfall
(iv) In August, there is at least 500 mm of rainfall

Source question diagram

Open complete paper
2
2016 · General Aptitude (GA) · Data Interpretation · Elementary Statistics
Physics (PH) 2016
Students taking an exam are divided into two groups, \(\mathbf{P}\) and \(\mathbf{Q}\) such that each group has the same number of students. The performance of each of the students in a test was evaluated out of 200 marks. It was observed that the mean of group \(\mathbf{P}\) was 105, while that of group \(\mathbf{Q}\) was 85. The standard deviation of group \(\mathbf{P}\) was 25, while that of group \(\mathbf{Q}\) was 5. Assuming that the marks were distributed on a normal distribution, which of the following statements will have the highest probability of being TRUE?
Open complete paper
3
2017 · General Aptitude (GA) · Data Interpretation · Elementary Statistics
Physics (PH) 2017
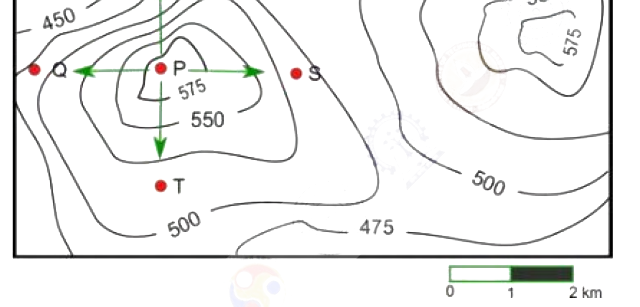
A contour line joins locations having the same height above the mean sea level. The following is a contour plot of a geographical region. Contour lines are shown at 25 m intervals in this plot.
Which of the following is the steepest path leaving from P?

Question diagram

Open complete paper
4
2018 · General Aptitude (GA) · Data Interpretation · Elementary Statistics
Physics (PH) 2018
To pass a test, a candidate needs to answer at least 2 out of 3 questions correctly. A total of 6,30,000 candidates appeared for the test. Question A was answered correctly by 3,30,000 candidates. Question B was answered correctly by 2,50,000 candidates. Question C was answered correctly by 2,60,000 candidates. Both questions A and B were answered correctly by 1,00,000 candidates. Both questions B and C were answered correctly by 90,000 candidates. Both questions A and C were answered correctly by 80,000 candidates. If the number of students answering all questions correctly is the same as the number answering none, how many candidates failed to clear the test?
Open complete paper
5
2018 · General Aptitude (GA) · Data Interpretation · Elementary Statistics
Physics (PH) 2018

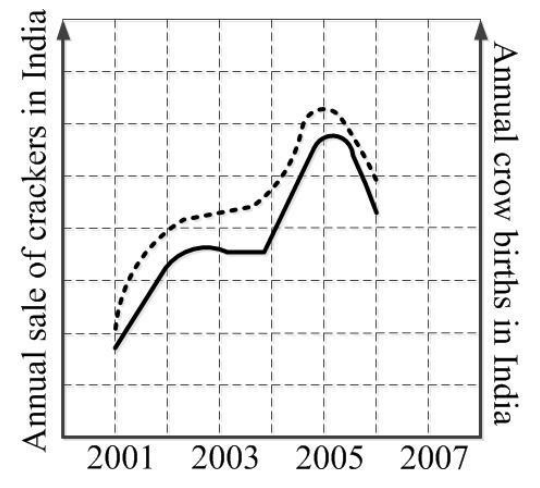
In a detailed study of annual crow births in India, it was found that there was relatively no growth during the period 2002 to 2004 and a sudden spike from 2004 to 2005. In another unrelated study, it was found that the revenue from cracker sales in India which remained fairly flat from 2002 to 2004, saw a sudden spike in 2005 before declining again in 2006. The solid line in the graph below refers to annual sale of crackers and the dashed line refers to the annual crow births in India. Choose the most appropriate inference from the above data.

Source question diagram

Open complete paper
6
2020 · General Aptitude (GA) · Data Interpretation · Elementary Statistics
Physics (PH) 2020
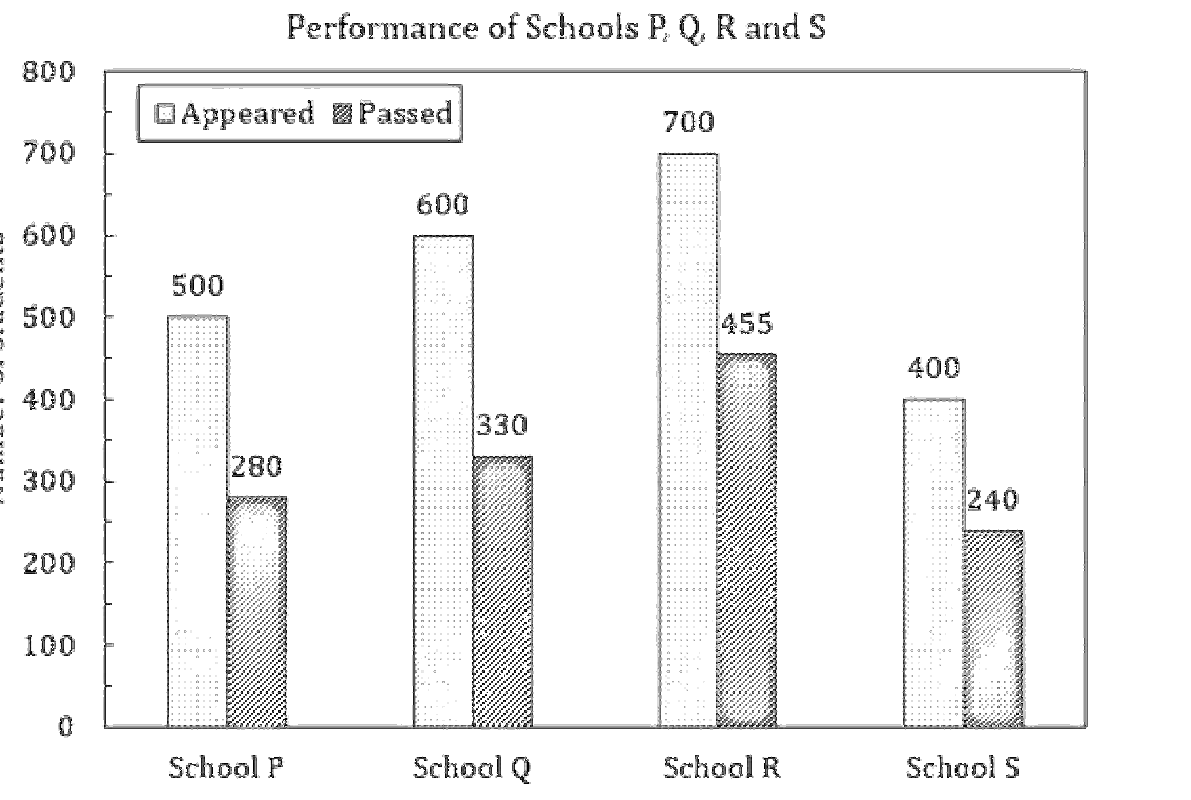
The bar graph shows the data of the students who appeared and passed in an examination for four schools P, Q, R and S. The average of success rates (in percentage) of these four schools is ______.
Open complete paper
7
2022 · General Aptitude (GA) · Data Interpretation · Elementary Statistics
Physics (PH) 2022
The above frequency chart shows the frequency distribution of marks obtained by a set of students in an exam.

From the data presented above, which one of the following is CORRECT?
Open complete paper
8
2024 · General Aptitude (GA) · Data Interpretation · Elementary Statistics
Physics (PH) 2024
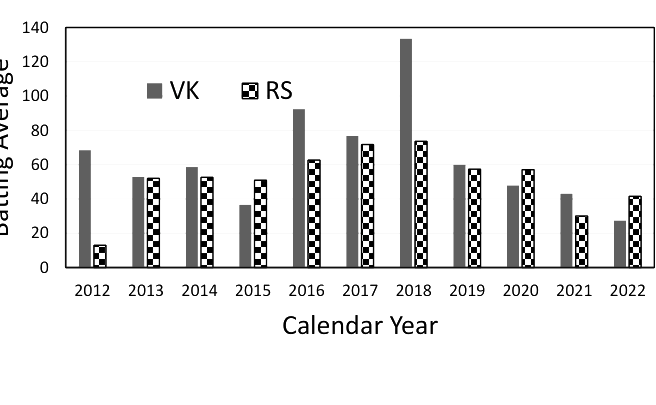
The bar chart gives the batting averages of VK and RS for 11 calendar years from 2012 to 2022. Considering that 2015 and 2019 are world cup years, which one of the following options is true?

Question diagram

Open complete paper