My Cart
Your Cart 0

    Your cart is empty.

  • Total (Amount) ₹0.00
Previous year question hub

Elementary Statistics - Data Interpretation - General Aptitude (GA) Previous Year Questions

Practice Elementary Statistics - Data Interpretation - General Aptitude (GA) previous year questions organised from real papers, with year-wise coverage and clear topic navigation.

5Papers
5Years
5Questions
1Topics

Elementary Statistics question pattern

Every graph below is calculated only from this selection.

Questions by year

Year-wise coverage for Elementary Statistics. Each bar uses a separate theme-derived color.

Difficulty distribution

How the classified questions are distributed by difficulty.

Easy 3 60%
Medium 2 40%

Question type distribution

MCQ, numerical, multiple-select and other formats found in these papers.

MCQ 5 100%

Subject weightage

Top subjects by unique question coverage.

General Aptitude (GA)
5 Qs

Most asked topics

Top topics across the included previous year papers.

Data Interpretation
5 Qs

Subtopic coverage

Top subtopics inside this exact selection.

Elementary Statistics
5 Qs

Paper coverage

Question coverage for the most populated papers. Every active PYP paper remains listed below.

Petroleum Engineering (PE) 2024
1 Qs
Petroleum Engineering (PE) 2023
1 Qs
Petroleum Engineering (PE) 2021
1 Qs
Petroleum Engineering (PE) 2020
1 Qs
Petroleum Engineering (PE) 2017
1 Qs

Included previous year papers

Newest papers appear first. Sort by year, question coverage or name.

PaperYear / sessionQuestions in this viewOpen
Petroleum Engineering (PE) 202420241View paper
Petroleum Engineering (PE) 202320231View paper
Petroleum Engineering (PE) 202120211View paper
Petroleum Engineering (PE) 202020201View paper
Petroleum Engineering (PE) 201720171View paper

All Elementary Statistics previous year questions

Practice every matching question in batches of 20, with every available option.

1
2017 · General Aptitude (GA) · Data Interpretation · Elementary Statistics
Petroleum Engineering (PE) 2017
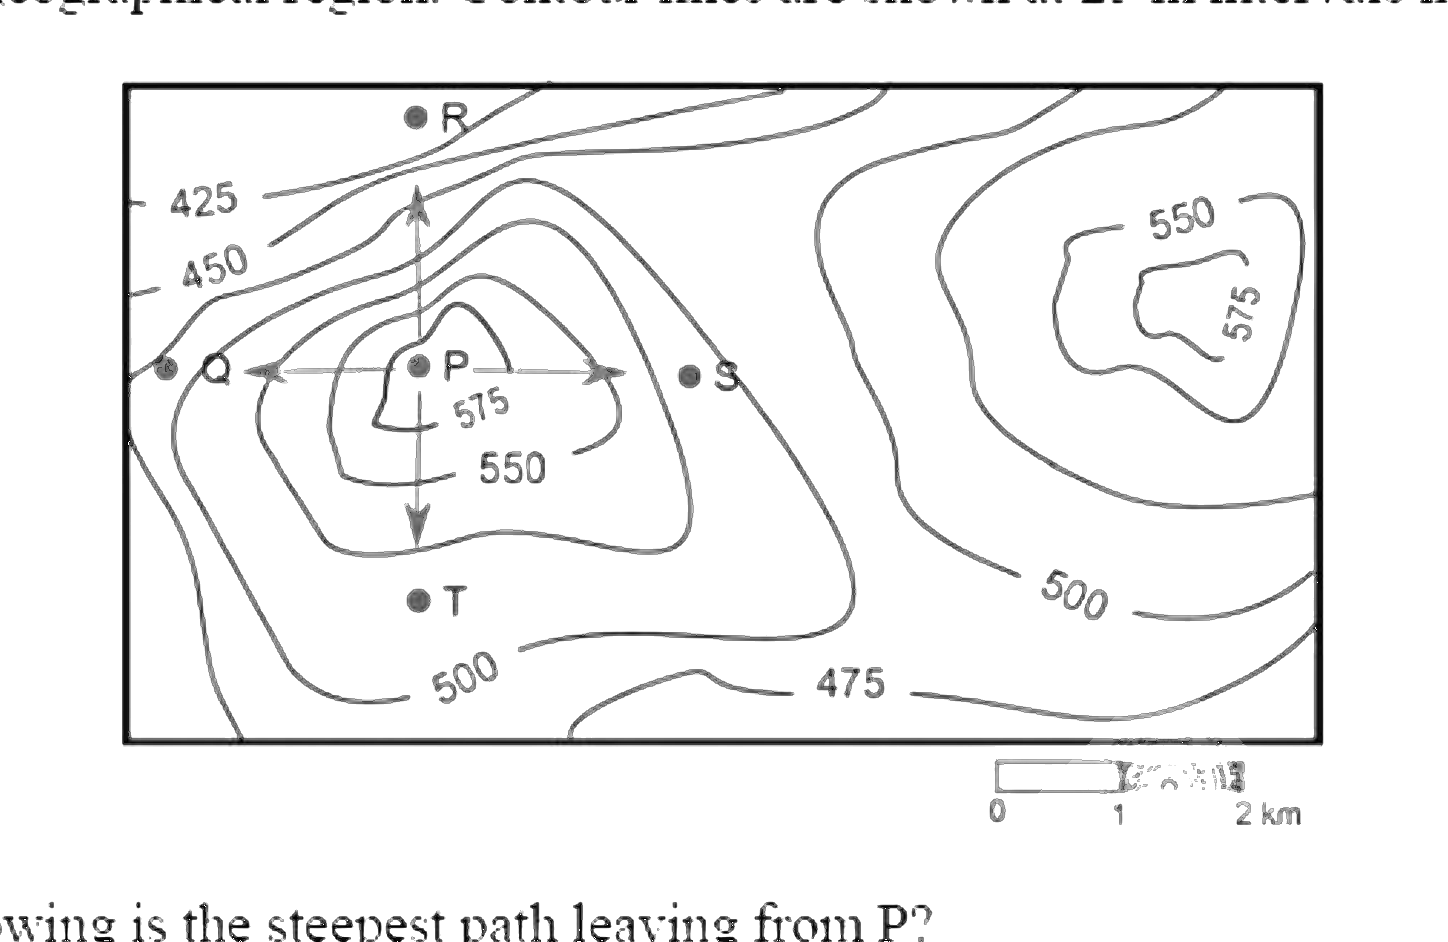
A contour line joins locations having the same height above the mean sea level. The following is a contour plot of a geographical region. Contour lines are shown at 25 m intervals in this plot.

Which of the following is the steepest path leaving from P?
Open complete paper
2
2020 · General Aptitude (GA) · Data Interpretation · Elementary Statistics
Petroleum Engineering (PE) 2020
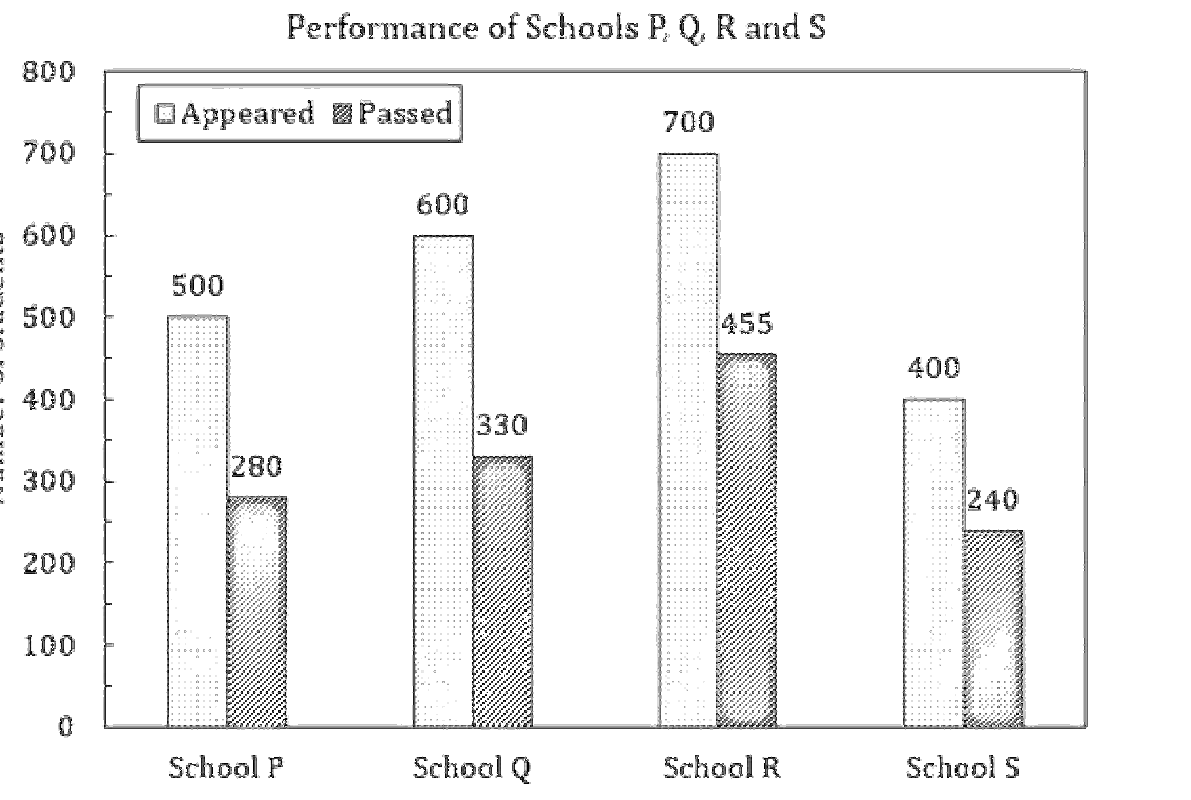
The bar graph shows the data of the students who appeared and passed in an examination for four schools P, Q, R and S. The average of success rates (in percentage) of these four schools is ______.
Open complete paper
3
2021 · General Aptitude (GA) · Data Interpretation · Elementary Statistics
Petroleum Engineering (PE) 2021
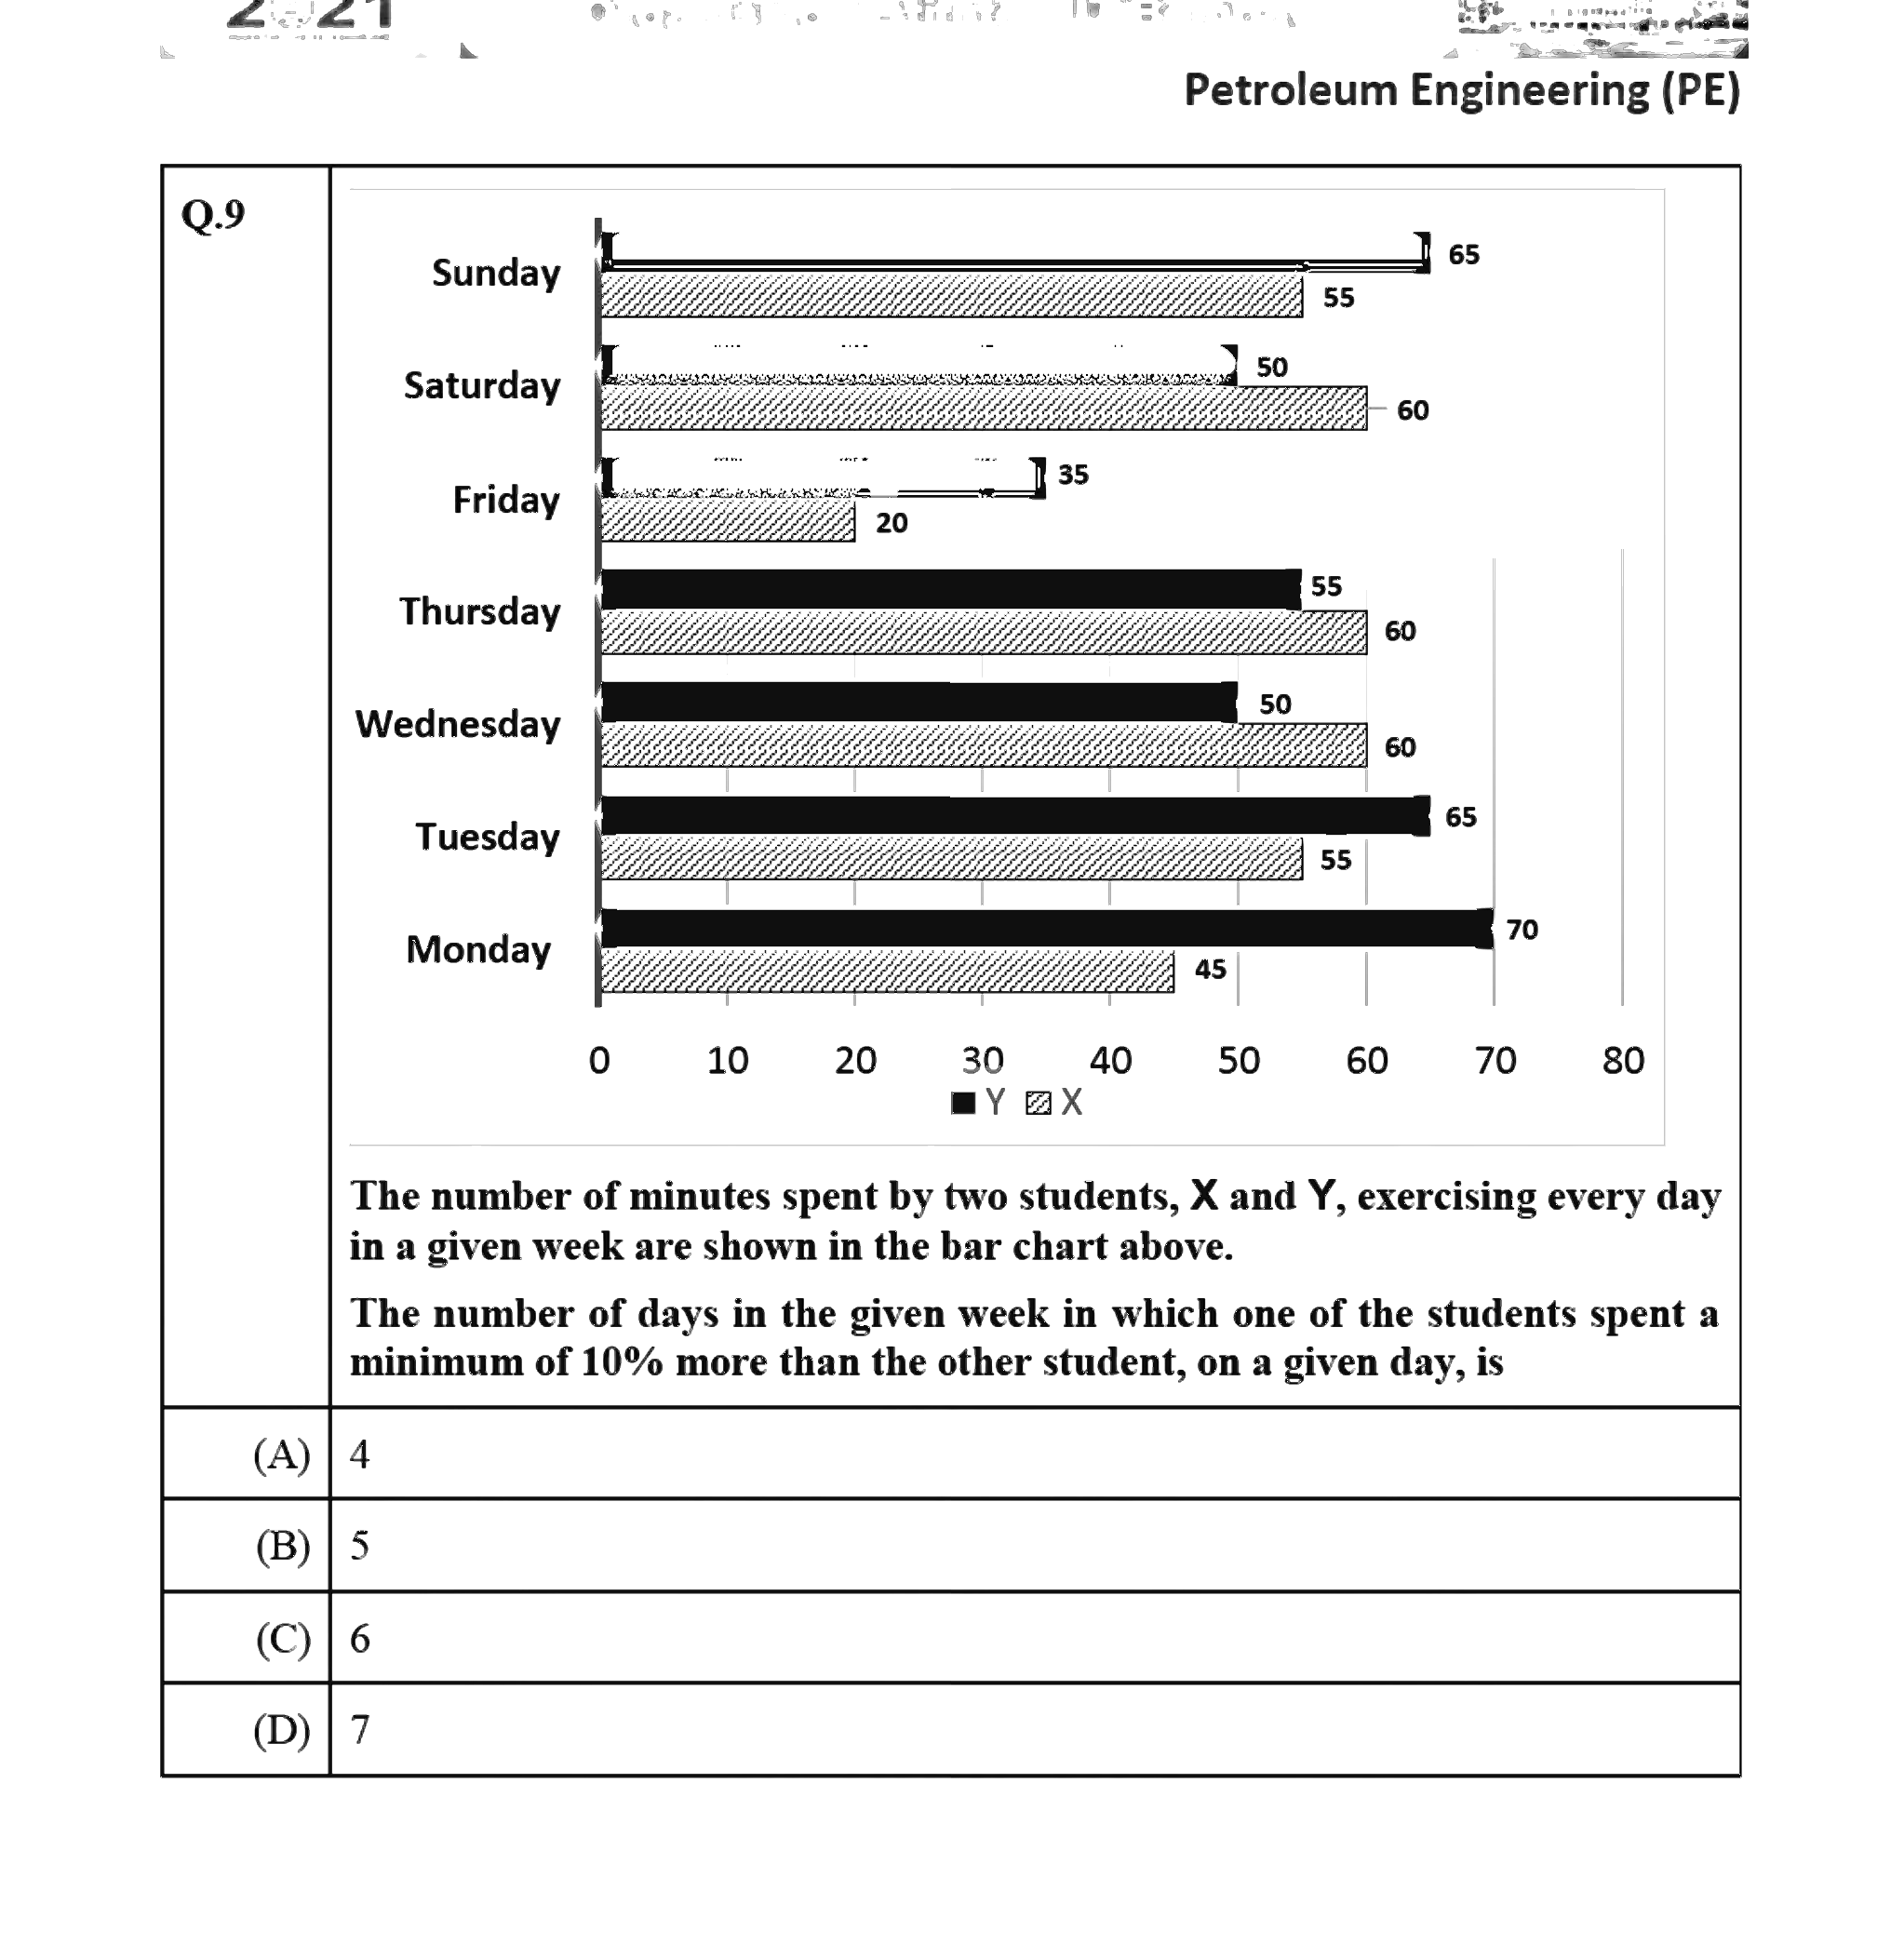
The number of minutes spent by two students, X and Y, exercising every day in a given week are shown in the bar chart above.
The number of days in the given week in which one of the students spent a minimum of 10% more than the other student, on a given day, is
Open complete paper
4
2024 · General Aptitude (GA) · Data Interpretation · Elementary Statistics
Petroleum Engineering (PE) 2024

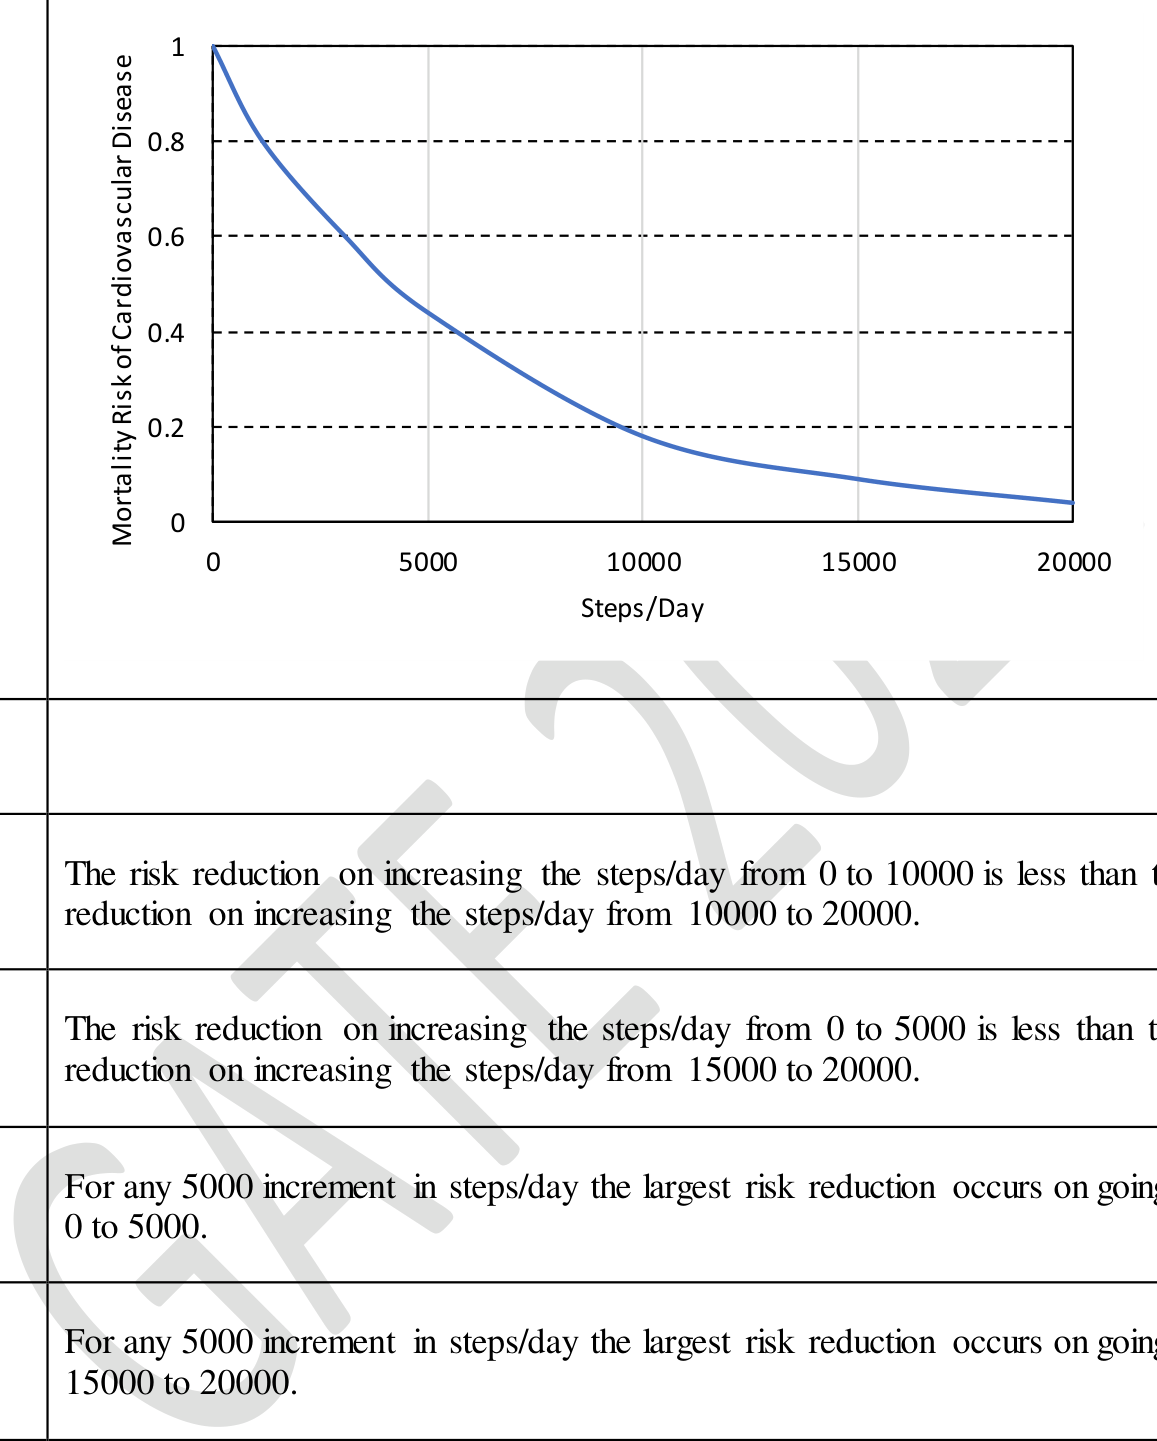
The plot below shows the relationship between the mortality risk of cardiovascular disease and the number of steps a person walks per day. Based on the data, which one of the following options is true?

Source question diagram

Open complete paper
5
2023 · General Aptitude (GA) · Data Interpretation · Elementary Statistics
Petroleum Engineering (PE) 2023
Which one among the following statements must be TRUE about the mean and the median of the scores of all candidates appearing for GATE 2023?
Open complete paper