My Cart
Your Cart 0

    Your cart is empty.

  • Total (Amount) ₹0.00
Previous year question hub

Elementary Statistics - Data Interpretation - General Aptitude (GA) Previous Year Questions

Practice Elementary Statistics - Data Interpretation - General Aptitude (GA) previous year questions organised from real papers, with year-wise coverage and clear topic navigation.

6Papers
6Years
8Questions
1Topics

Elementary Statistics question pattern

Every graph below is calculated only from this selection.

Questions by year

Year-wise coverage for Elementary Statistics. Each bar uses a separate theme-derived color.

Difficulty distribution

How the classified questions are distributed by difficulty.

Medium 4 50%
Easy 4 50%

Question type distribution

MCQ, numerical, multiple-select and other formats found in these papers.

MCQ 6 75%
Numerical Answer Type (NAT) 2 25%

Subject weightage

Top subjects by unique question coverage.

General Aptitude (GA)
8 Qs

Most asked topics

Top topics across the included previous year papers.

Data Interpretation
8 Qs

Subtopic coverage

Top subtopics inside this exact selection.

Elementary Statistics
8 Qs

Paper coverage

Question coverage for the most populated papers. Every active PYP paper remains listed below.

Mining Engineering (MN) 2024
1 Qs
Mining Engineering (MN) 2019
1 Qs
Mining Engineering (MN) 2017
1 Qs
Mining Engineering (MN) 2016
1 Qs
Mining Engineering (MN) 2015
3 Qs
Mining Engineering (MN) 2014
1 Qs

Included previous year papers

Newest papers appear first. Sort by year, question coverage or name.

PaperYear / sessionQuestions in this viewOpen
Mining Engineering (MN) 202420241View paper
Mining Engineering (MN) 201920191View paper
Mining Engineering (MN) 201720171View paper
Mining Engineering (MN) 201620161View paper
Mining Engineering (MN) 201520153View paper
Mining Engineering (MN) 201420141View paper

All Elementary Statistics previous year questions

Practice every matching question in batches of 20, with every available option.

1
2014 · General Aptitude (GA) · Data Interpretation · Elementary Statistics
Mining Engineering (MN) 2014
The total exports and revenues from the exports of a country are given in the two pie charts below. The pie chart for exports shows the quantity of each item as a percentage of the total quantity of exports. The pie chart for the revenues shows the percentage of the total revenue generated through export of each item. The total quantity of exports of all the items is 5 lakh tonnes and the total revenues are 250 crore rupees. What is the ratio of the revenue generated through export of Item 1 per kilogram to the revenue generated through export of Item 4 per kilogram?
Open complete paper
2
2015 · General Aptitude (GA) · Data Interpretation · Elementary Statistics
Mining Engineering (MN) 2015
The covariance of copper grade for a certain lag distance in an ore body is 6.0 (%). If the sill is 10 (%), the semivariogram for the same lag distance in (%) is
Open complete paper
3
2015 · General Aptitude (GA) · Data Interpretation · Elementary Statistics
Mining Engineering (MN) 2015
An underground coal mine employing 1200 persons experiences 2 fatal injuries, 6 serious injuries and 8 reportable injuries during the year 2013. The total injury rate per 1000 persons employed for the year is ______
Open complete paper
4
2015 · General Aptitude (GA) · Data Interpretation · Elementary Statistics
Mining Engineering (MN) 2015
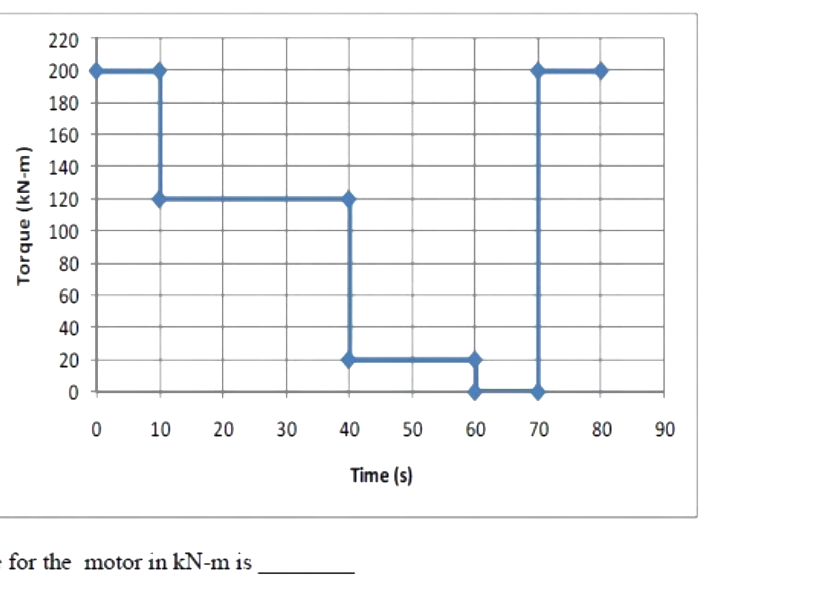
The 3-period torque-time diagram of a statically balanced hoist is shown in the figure.
The rms torque for the motor in kN-m is ________

Question diagram

Open complete paper
5
2016 · General Aptitude (GA) · Data Interpretation · Elementary Statistics
Mining Engineering (MN) 2016
Students taking an exam are divided into two groups, P and Q such that each group has the same number of students. The performance of each of the students in a test was evaluated out of 200 marks. It was observed that the mean of group P was 105, while that of group Q was 85. The standard deviation of group P was 25, while that of group Q was 5. Assuming that the marks were distributed on a normal distribution, which of the following statements will have the highest probability of being TRUE?
Open complete paper
6
2017 · General Aptitude (GA) · Data Interpretation · Elementary Statistics
Mining Engineering (MN) 2017
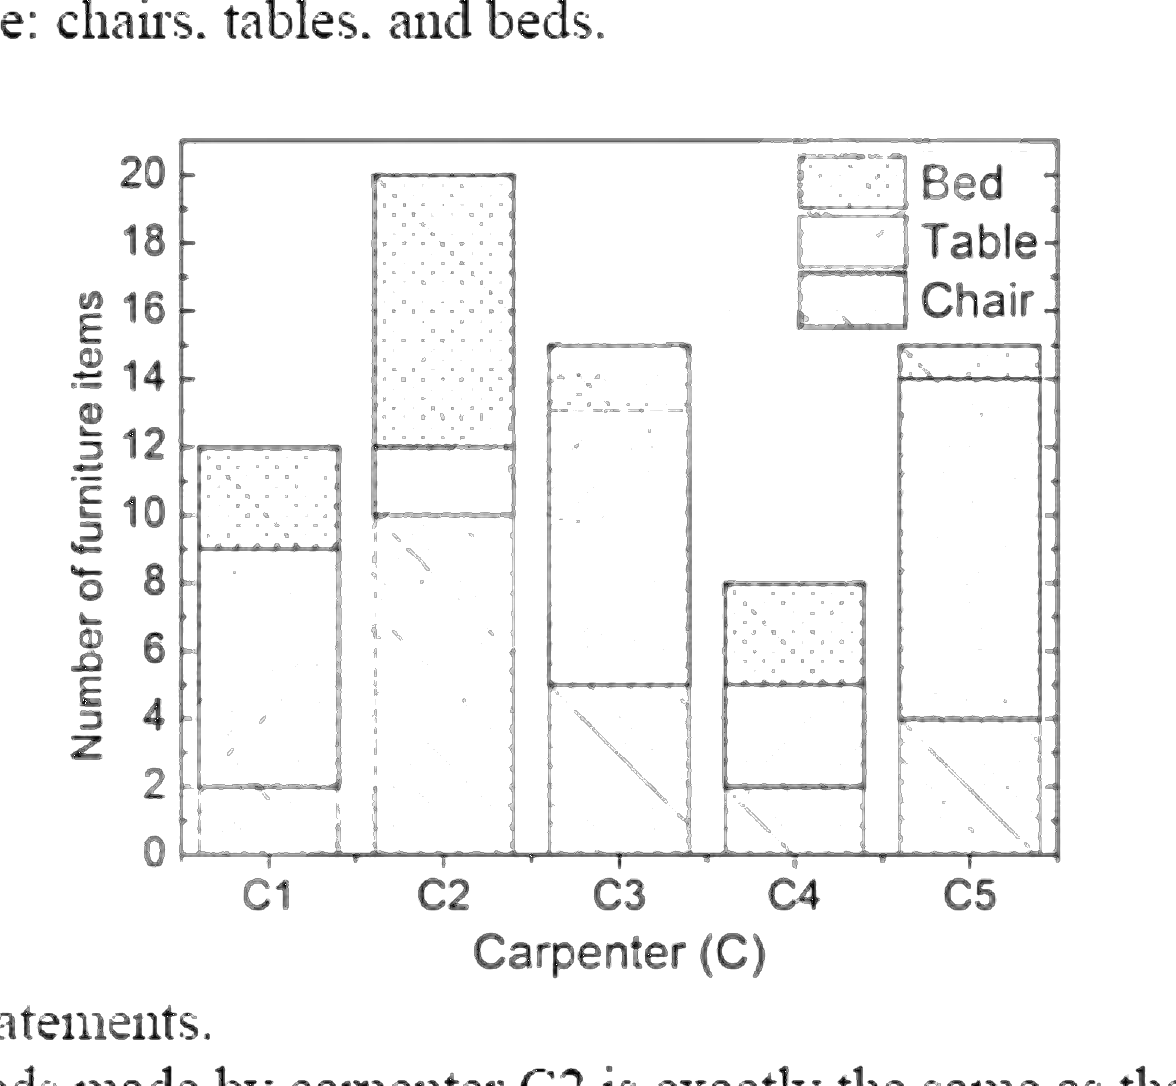
The bar graph below shows the output of five carpenters over one month, each of whom made different items of furniture: chairs, tables, and beds.
Consider the following statements.
i. The number of beds made by carpenter C2 is exactly the same as the number of tables made by carpenter C3.
ii. The total number of chairs made by all carpenters is less than the total number of tables.
Which one of the following is true?
Open complete paper
7
2019 · General Aptitude (GA) · Data Interpretation · Elementary Statistics
Mining Engineering (MN) 2019

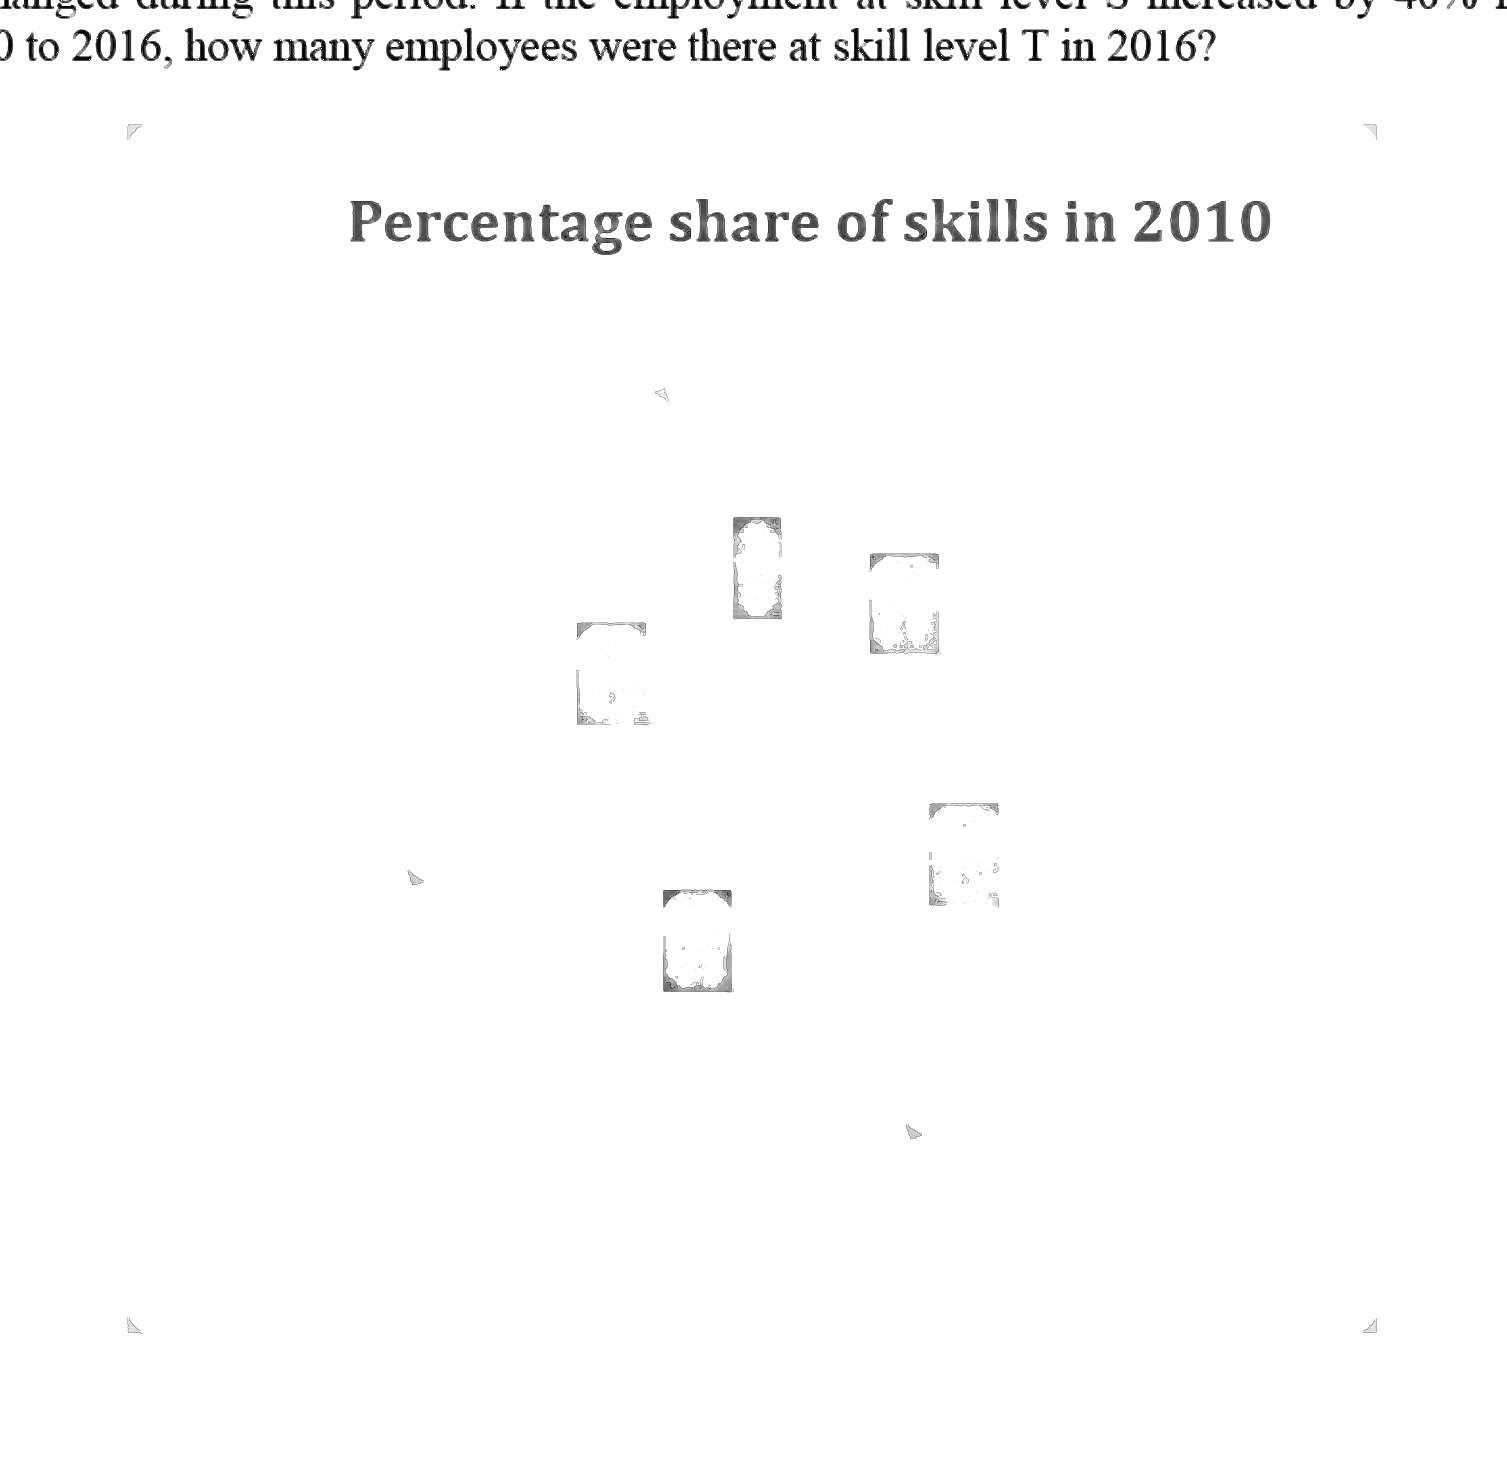
A firm hires employees at five different skill levels P, Q, R, S, T. The shares of employment at these skill levels of total employment in 2010 is given in the pie chart as shown. There were a total of 600 employees in 2010 and the total employment increased by 15% from 2010 to 2016. The total employment at skill levels P, Q and R remained unchanged during this period. If the employment at skill level S increased by 40% from 2010 to 2016, how many employees were there at skill level T in 2016?

Open complete paper
8
2024 · General Aptitude (GA) · Data Interpretation · Elementary Statistics
Mining Engineering (MN) 2024

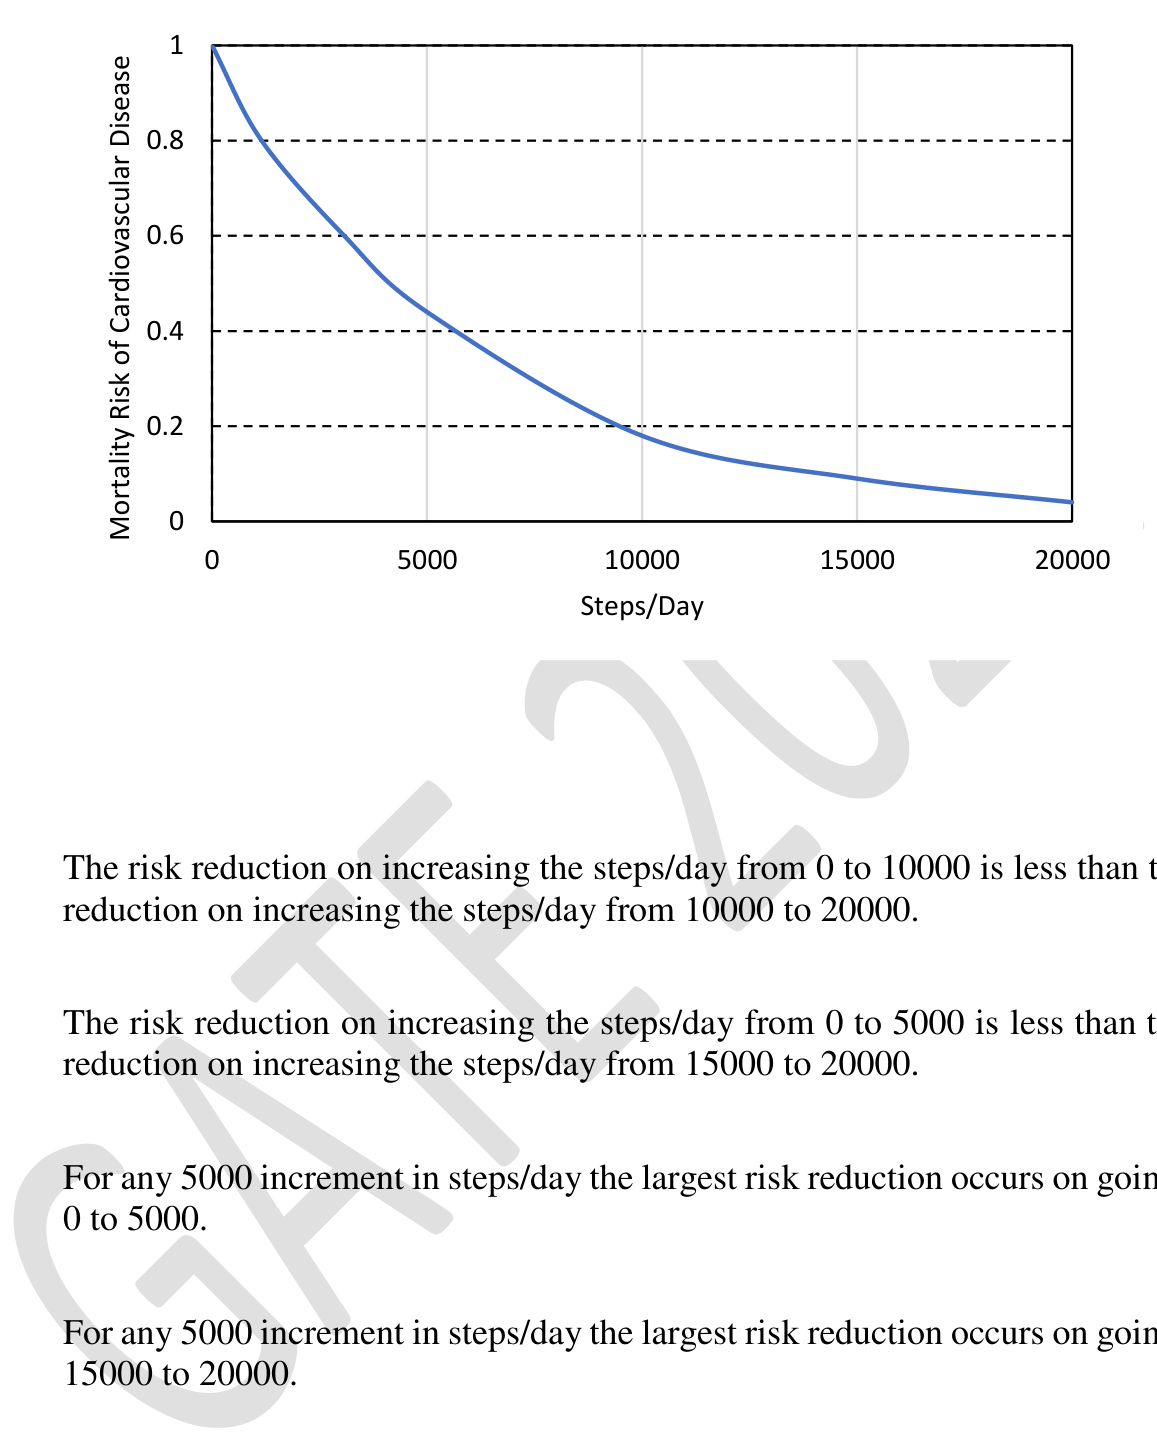
The plot below shows the relationship between the mortality risk of cardiovascular disease and the number of steps a person walks per day. Based on the data, which one of the following options is true?

Source question diagram

Open complete paper