My Cart
Your Cart 0

    Your cart is empty.

  • Total (Amount) ₹0.00
Previous year question hub

Data Interpretation - General Aptitude - General Aptitude (GA) Previous Year Questions

Practice Data Interpretation - General Aptitude - General Aptitude (GA) previous year questions organised from real papers, with year-wise coverage and clear topic navigation.

3Papers
3Years
6Questions
1Topics

Data Interpretation question pattern

Every graph below is calculated only from this selection.

Questions by year

Year-wise coverage for Data Interpretation. Each bar uses a separate theme-derived color.

Difficulty distribution

How the classified questions are distributed by difficulty.

Medium 4 66.7%
Easy 2 33.3%

Question type distribution

MCQ, numerical, multiple-select and other formats found in these papers.

MCQ 6 100%

Subject weightage

Top subjects by unique question coverage.

General Aptitude (GA)
6 Qs

Most asked topics

Top topics across the included previous year papers.

General Aptitude
6 Qs

Subtopic coverage

Top subtopics inside this exact selection.

Data Interpretation
6 Qs

Paper coverage

Question coverage for the most populated papers. Every active PYP paper remains listed below.

Metallurgical Engineering (MT) 2018
1 Qs
Metallurgical Engineering (MT) 2017
1 Qs
Metallurgical Engineering (MT) 2015
4 Qs

Included previous year papers

Newest papers appear first. Sort by year, question coverage or name.

PaperYear / sessionQuestions in this viewOpen
Metallurgical Engineering (MT) 201820181View paper
Metallurgical Engineering (MT) 201720171View paper
Metallurgical Engineering (MT) 201520154View paper

All Data Interpretation previous year questions

Practice every matching question in batches of 20, with every available option.

1
2015 · General Aptitude (GA) · General Aptitude · Data Interpretation
Metallurgical Engineering (MT) 2015
In an Ellingham diagram, the standard free energy change ΔG° for the oxidation reaction of a metal M given by: xM(s) + O₂(g) → MₓO₂(s), is plotted as a function of temperature. The slope of this line is positive because
Open complete paper
2
2015 · General Aptitude (GA) · General Aptitude · Data Interpretation
Metallurgical Engineering (MT) 2015
A species can diffuse through the lattice (diffusion coefficient, D_L), along grain boundaries (diffusion coefficient, D_GB), and along free surfaces (diffusion coefficient, D_S). Which of the following relations is CORRECT?
Open complete paper
3
2015 · General Aptitude (GA) · General Aptitude · Data Interpretation
Metallurgical Engineering (MT) 2015

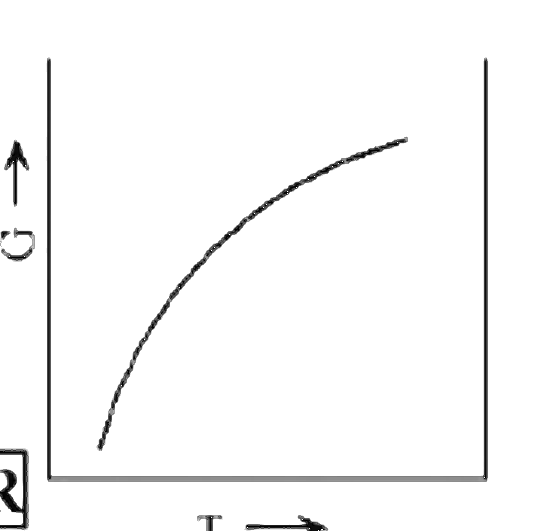
Select the CORRECT plot of Gibbs free energy (G) vs. temperature (T) for a single component system from the following:

Open complete paper
4
2015 · General Aptitude (GA) · General Aptitude · Data Interpretation
Metallurgical Engineering (MT) 2015

Based on the standard galvanic series, select the CORRECT sequence of metals in the increasing order of anodic behaviour:

Open complete paper
5
2017 · General Aptitude (GA) · General Aptitude · Data Interpretation
Metallurgical Engineering (MT) 2017
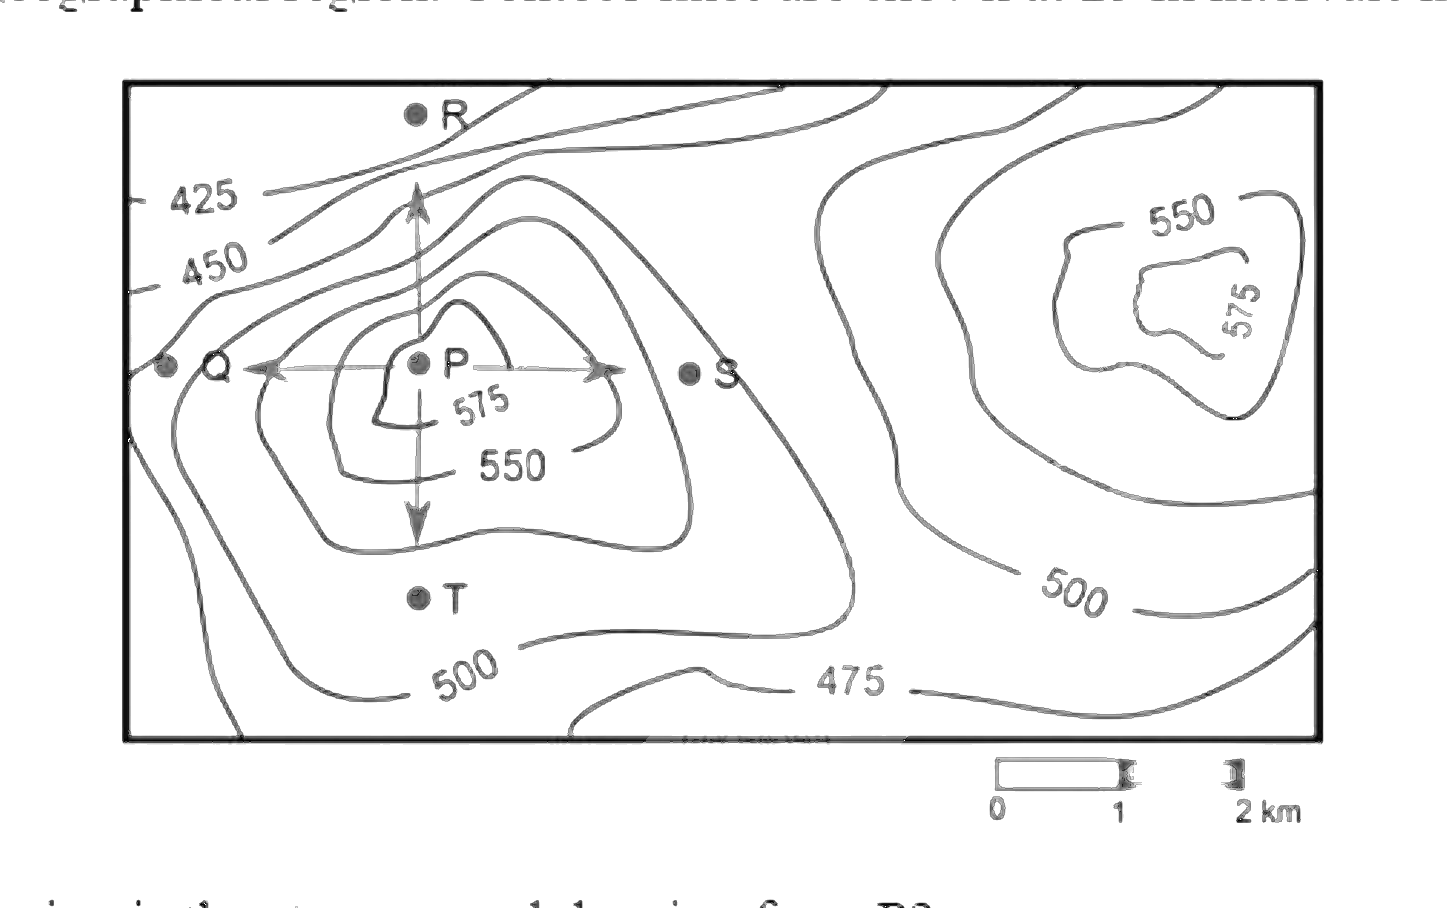
A contour line joins locations having the same height above the mean sea level. The following is a contour plot of a geographical region. Contour lines are shown at 25 m intervals in this plot.

[Image of a contour plot]
Which of the following is the steepest path leaving from P?
Open complete paper
6
2018 · General Aptitude (GA) · General Aptitude · Data Interpretation
Metallurgical Engineering (MT) 2018

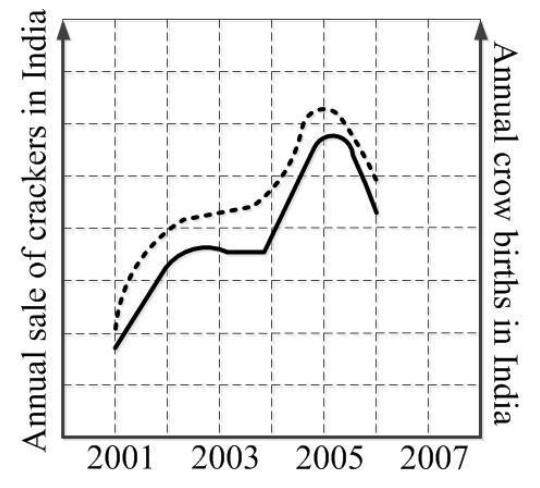
In a detailed study of annual crow births in India, it was found that there was relatively no growth during the period 2002 to 2004 and a sudden spike from 2004 to 2005. In another unrelated study, it was found that the revenue from cracker sales in India which remained fairly flat from 2002 to 2004, saw a sudden spike in 2005 before declining again in 2006. The solid line in the graph below refers to annual sale of crackers and the dashed line refers to the annual crow births in India. Choose the most appropriate inference from the above data.

Source question diagram

Open complete paper