My Cart
Your Cart 0

    Your cart is empty.

  • Total (Amount) ₹0.00
Previous year question hub

Elementary Statistics - Data Interpretation - General Aptitude (GA) Previous Year Questions

Practice Elementary Statistics - Data Interpretation - General Aptitude (GA) previous year questions organised from real papers, with year-wise coverage and clear topic navigation.

14Papers
9Years
16Questions
1Topics

Elementary Statistics question pattern

Every graph below is calculated only from this selection.

Questions by year

Year-wise coverage for Elementary Statistics. Each bar uses a separate theme-derived color.

Difficulty distribution

How the classified questions are distributed by difficulty.

Medium 10 62.5%
Easy 6 37.5%

Question type distribution

MCQ, numerical, multiple-select and other formats found in these papers.

MCQ 12 75%
Numerical Answer Type (NAT) 4 25%

Subject weightage

Top subjects by unique question coverage.

General Aptitude (GA)
16 Qs

Most asked topics

Top topics across the included previous year papers.

Data Interpretation
16 Qs

Subtopic coverage

Top subtopics inside this exact selection.

Elementary Statistics
16 Qs

Paper coverage

Question coverage for the most populated papers. Every active PYP paper remains listed below.

Mechanical Engineering (ME) 2024
1 Qs
Mechanical Engineering (ME) 2023
1 Qs
Mechanical Engineering (ME) 2021 [Session 1]
1 Qs
Mechanical Engineering (ME) 2020 [Session 1]
1 Qs
Mechanical Engineering (ME) 2020 [Session 2]
1 Qs
Mechanical Engineering (ME) 2019 [Session 1]
1 Qs
Mechanical Engineering (ME) 2019 [Session 2]
1 Qs
Mechanical Engineering (ME) 2016 [Session 1]
1 Qs
Mechanical Engineering (ME) 2016 [Session 3]
1 Qs
Mechanical Engineering (ME) 2015 [Session 1]
2 Qs
Mechanical Engineering (ME) 2015 [Session 2]
1 Qs
Mechanical Engineering (ME) 2014 [Session 3]
2 Qs
Mechanical Engineering (ME) 2014 [Session 4]
1 Qs
Mechanical Engineering (ME) 2012
1 Qs

Included previous year papers

Newest papers appear first. Sort by year, question coverage or name.

PaperYear / sessionQuestions in this viewOpen
Mechanical Engineering (ME) 202420241View paper
Mechanical Engineering (ME) 202320231View paper
Mechanical Engineering (ME) 2021 [Session 1]20211View paper
Mechanical Engineering (ME) 2020 [Session 1]20201View paper
Mechanical Engineering (ME) 2020 [Session 2]20201View paper
Mechanical Engineering (ME) 2019 [Session 1]20191View paper
Mechanical Engineering (ME) 2019 [Session 2]20191View paper
Mechanical Engineering (ME) 2016 [Session 1]20161View paper
Mechanical Engineering (ME) 2016 [Session 3]20161View paper
Mechanical Engineering (ME) 2015 [Session 1]20152View paper
Mechanical Engineering (ME) 2015 [Session 2]20151View paper
Mechanical Engineering (ME) 2014 [Session 3]20142View paper
Mechanical Engineering (ME) 2014 [Session 4]20141View paper
Mechanical Engineering (ME) 201220121View paper

All Elementary Statistics previous year questions

Practice every matching question in batches of 20, with every available option.

1
2012 · General Aptitude (GA) · Data Interpretation · Elementary Statistics
Mechanical Engineering (ME) 2012
The rate at which heat is extracted, in kJ/s from the refrigerated space is

Question diagram

Open complete paper
2
2014 · General Aptitude (GA) · Data Interpretation · Elementary Statistics
Mechanical Engineering (ME) 2014 [Session 3]
The statistics of runs scored in a series by four batsmen are provided in the following table. Who is the most consistent batsman of these four?

Question diagram

Open complete paper
3
2014 · General Aptitude (GA) · Data Interpretation · Elementary Statistics
Mechanical Engineering (ME) 2014 [Session 3]
The exports and imports (in crores of Rs.) of a country from 2000 to 2007 are given in the following bar chart. If the trade deficit is defined as excess of imports over exports, in which year is the trade deficit 1/5th of the exports?

Question diagram

Open complete paper
4
2014 · General Aptitude (GA) · Data Interpretation · Elementary Statistics
Mechanical Engineering (ME) 2014 [Session 4]
The total exports and revenues from the exports of a country are given in the two charts shown below. The pie chart for exports shows the quantity of each item exported as a percentage of the total quantity of exports. The pie chart for the revenues shows the percentage of the total revenue generated through export of each item. The total quantity of exports of all the items is 500 thousand tonnes and the total revenues are 250 crore rupees. Which item among the following has generated the maximum revenue per kg?
Open complete paper
5
2015 · General Aptitude (GA) · Data Interpretation · Elementary Statistics
Mechanical Engineering (ME) 2015 [Session 1]
An electric bus has onboard instruments that report the total electricity consumed since the start of the trip as well as the total distance covered. During a single day of operation, the bus travels on stretches M, N, O, and P, in that order. The cumulative distances travelled and the corresponding electricity consumption are shown in the Table below.
StretchCumulative distance (km)Electricity used (kWh)
M2012
N4525
O7545
P10057

The stretch where the electricity consumption per km is minimum is

Question diagram

Open complete paper
6
2015 · General Aptitude (GA) · Data Interpretation · Elementary Statistics
Mechanical Engineering (ME) 2015 [Session 1]
For a canteen, the actual demand for disposable cups was 500 units in January and 600 units in February. The forecast for the month of January was 400 units. The forecast for the month of March considering smoothing coefficient as 0.75 is ______
Open complete paper
7
2015 · General Aptitude (GA) · Data Interpretation · Elementary Statistics
Mechanical Engineering (ME) 2015 [Session 2]
Sales data of a product is given in the following table:
MonthJanuaryFebruaryMarchAprilMay
Number of units sold1011161925

Regarding forecast for the month of June, which one of the following statements is TRUE?

Question diagram

Open complete paper
8
2016 · General Aptitude (GA) · Data Interpretation · Elementary Statistics
Mechanical Engineering (ME) 2016 [Session 1]

In a huge pile of apples and oranges, both ripe and unripe mixed together, 15% are unripe fruits. Of the unripe fruits, 45% are apples. Of the ripe ones, 66% are oranges. If the pile contains a total of 5692000 fruits, how many of them are apples?

Open complete paper
9
2016 · General Aptitude (GA) · Data Interpretation · Elementary Statistics
Mechanical Engineering (ME) 2016 [Session 3]
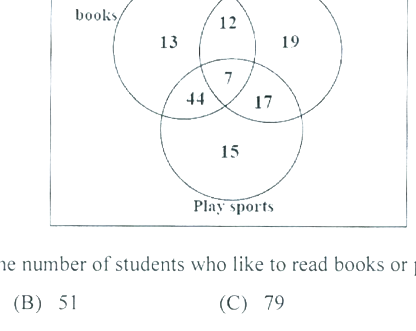
The Venn diagram shows the preference of the student population for leisure activities.
From the data given, the number of students who like to read books or play sports is __________.

Question diagram

Open complete paper
10
2019 · General Aptitude (GA) · Data Interpretation · Elementary Statistics
Mechanical Engineering (ME) 2019 [Session 1]
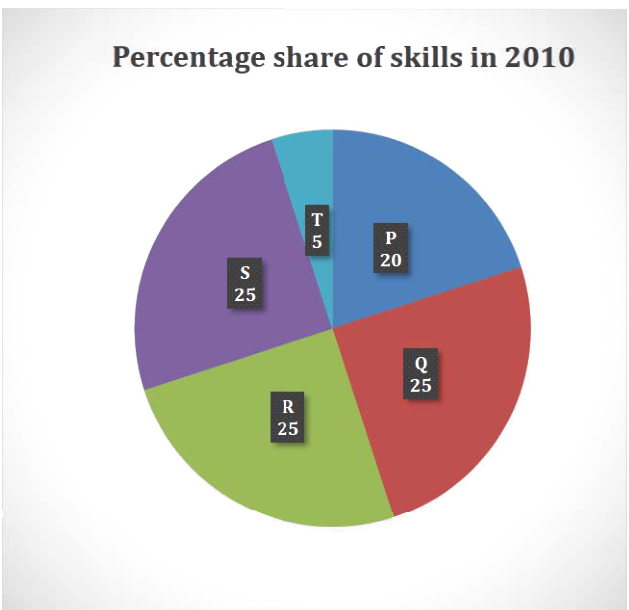
A firm hires employees at five different skill levels P, Q, R, S, T. The shares of employment at these skill levels of total employment in 2010 is given in the pie chart as shown. There were a total of 600 employees in 2010 and the total employment increased by 15% from 2010 to 2016. The total employment at skill levels P, Q and R remained unchanged during this period. If the employment at skill level S increased by 40% from 2010 to 2016, how many employees were there at skill level T in 2016?

Question diagram

Open complete paper
11
2019 · General Aptitude (GA) · Data Interpretation · Elementary Statistics
Mechanical Engineering (ME) 2019 [Session 2]
Mola is a digital platform for taxis in a city. It offers three types of rides – Pool, Mini and Prime. The Table below presents the number of rides for the past four months. The platform earns one US dollar per ride. What is the percentage share of revenue contributed by Prime to the total revenues of Mola, for the entire duration?
Open complete paper
12
2020 · General Aptitude (GA) · Data Interpretation · Elementary Statistics
Mechanical Engineering (ME) 2020 [Session 1]
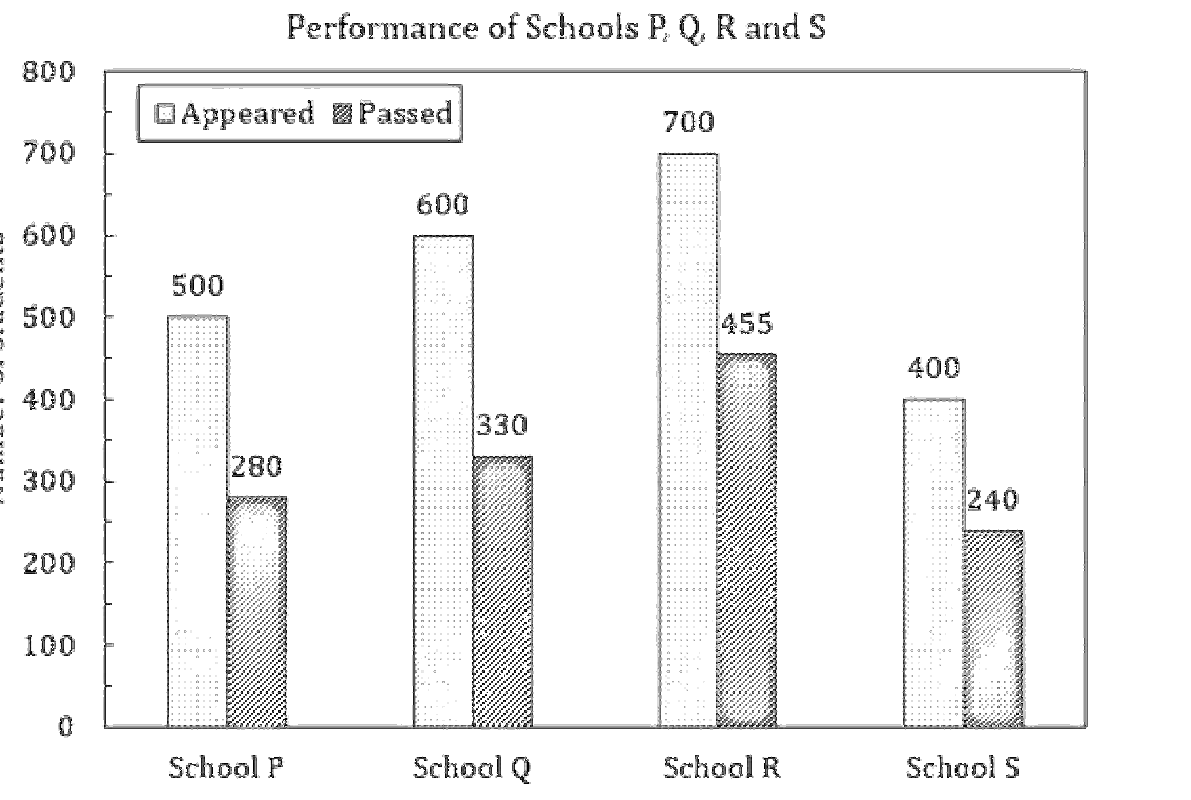
The bar graph shows the data of the students who appeared and passed in an examination for four schools P, Q, R and S. The average of success rates (in percentage) of these four schools is ______.
Open complete paper
13
2020 · General Aptitude (GA) · Data Interpretation · Elementary Statistics
Mechanical Engineering (ME) 2020 [Session 2]
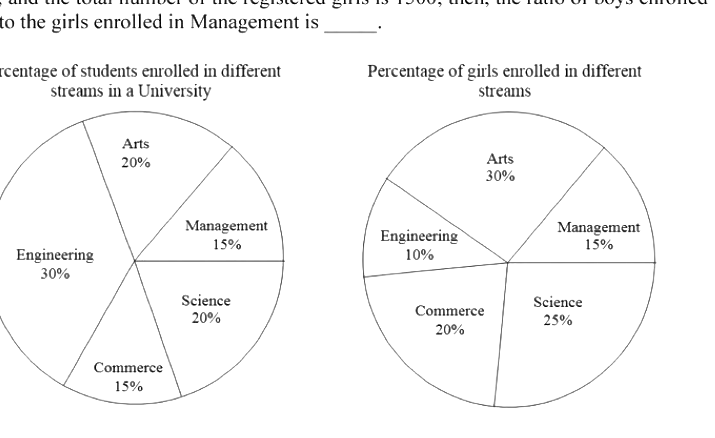
The two pie-charts given below show the data of total students and only girls registered in different streams in a university. If the total number of students registered in the university is 5000, and the total number of the registered girls is 1500; then, the ratio of boys enrolled in Arts to the girls enrolled in Management is ______.

Question diagram

Open complete paper
14
2021 · General Aptitude (GA) · Data Interpretation · Elementary Statistics
Mechanical Engineering (ME) 2021 [Session 1]
The distribution of employees at the rank of executives, across different companies C1, C2, ..., C6 is presented in the chart given above. The ratio of executives with a management degree to those without a management degree in each of these companies is provided in the table above. The total number of executives across all companies is 10,000.
The total number of management degree holders among the executives in companies C2 and C5 together is____.
Open complete paper
15
2023 · General Aptitude (GA) · Data Interpretation · Elementary Statistics
Mechanical Engineering (ME) 2023
A certain country has 504 universities and 25951 colleges. These are categorised into Grades I, II, and III as shown in the given pie charts.

What is the percentage, correct to one decimal place, of higher education institutions (colleges and universities) that fall into Grade III?
Open complete paper
16
2024 · General Aptitude (GA) · Data Interpretation · Elementary Statistics
Mechanical Engineering (ME) 2024

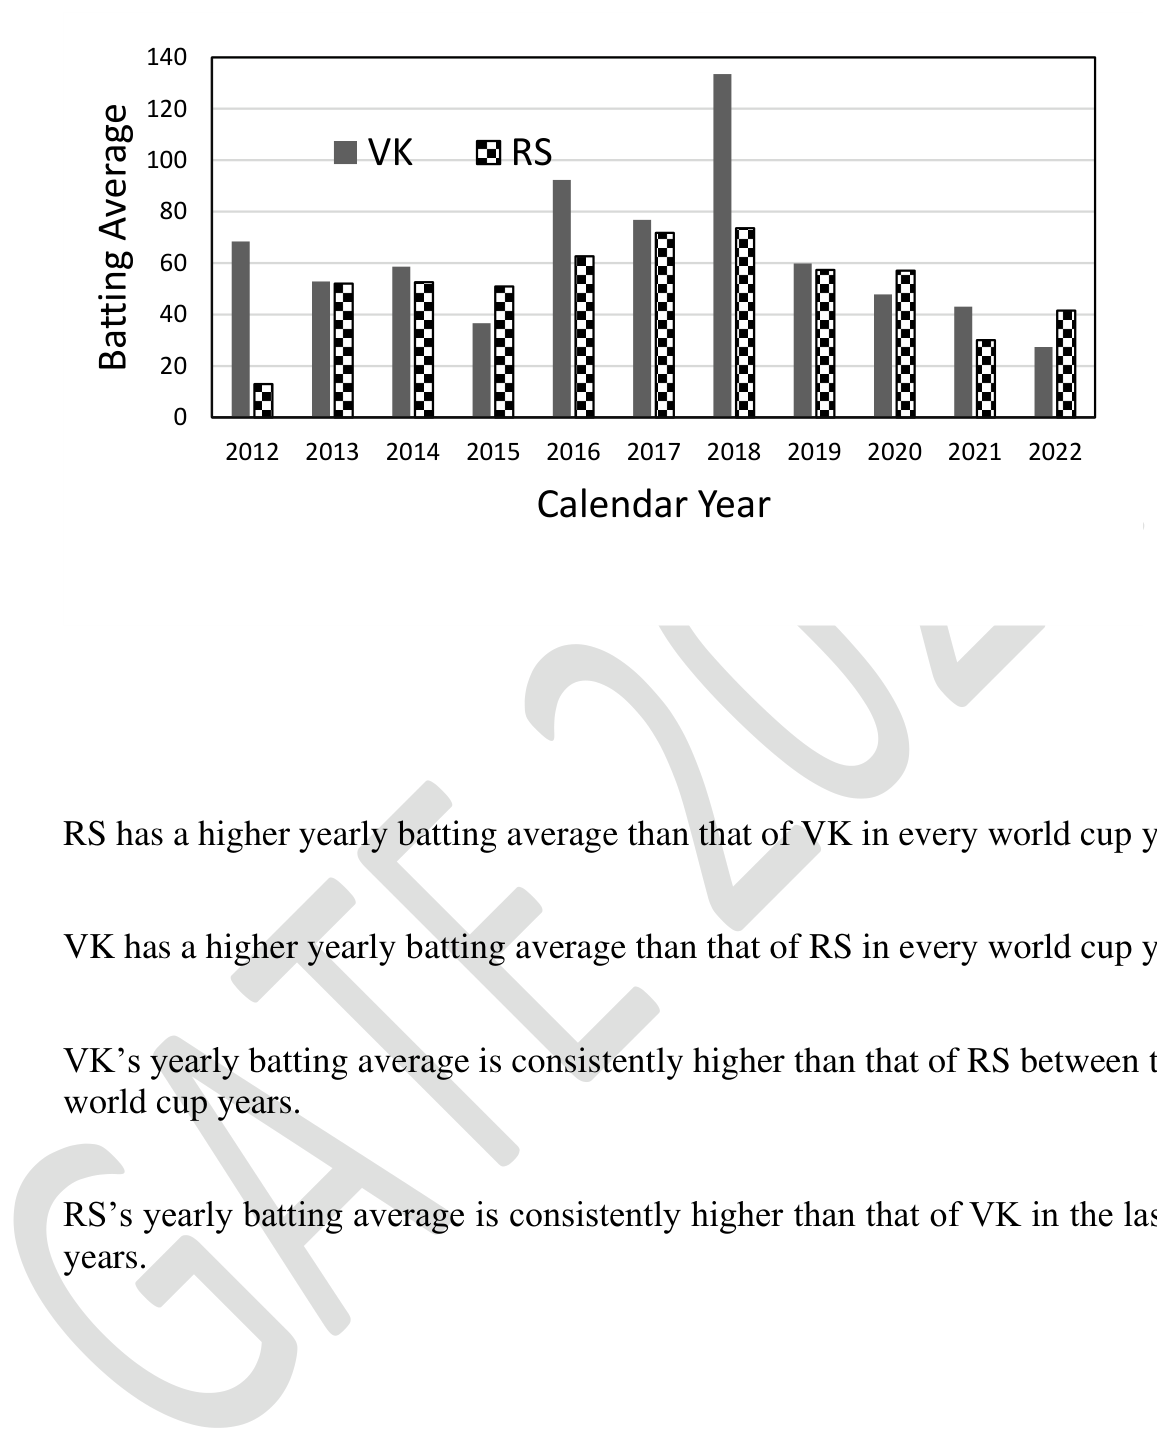
The bar chart gives the batting averages of VK and RS for 11 calendar years from 2012 to 2022. Considering that 2015 and 2019 are world cup years, which one of the following options is true?

Source question diagram

Open complete paper