My Cart
Your Cart 0

    Your cart is empty.

  • Total (Amount) ₹0.00
Previous year question hub

Data Interpretation - General Aptitude (GA) Previous Year Questions

Practice Data Interpretation - General Aptitude (GA) previous year questions organised from real papers, with year-wise coverage and clear topic navigation.

8Papers
8Years
8Questions
1Topics

Data Interpretation question pattern

Every graph below is calculated only from this selection.

Questions by year

Year-wise coverage for Data Interpretation. Each bar uses a separate theme-derived color.

Difficulty distribution

How the classified questions are distributed by difficulty.

Easy 4 50%
Medium 4 50%

Question type distribution

MCQ, numerical, multiple-select and other formats found in these papers.

MCQ 6 75%
Numerical Answer Type (NAT) 2 25%

Subject weightage

Top subjects by unique question coverage.

General Aptitude (GA)
8 Qs

Most asked topics

Top topics across the included previous year papers.

Data Interpretation
8 Qs

Subtopic coverage

Top subtopics inside this exact selection.

Elementary Statistics
8 Qs

Paper coverage

Question coverage for the most populated papers. Every active PYP paper remains listed below.

Life Sciences (XL) 2024
1 Qs
Life Sciences (XL) 2023
1 Qs
Life Sciences (XL) 2022
1 Qs
Life Sciences (XL) 2021
1 Qs
Life Sciences (XL) 2019
1 Qs
Life Sciences (XL) 2016
1 Qs
Life Sciences (XL) 2015
1 Qs
Life Sciences (XL) 2012
1 Qs

Browse by subtopics

Open a focused page built from the same verified paper data.

Included previous year papers

Newest papers appear first. Sort by year, question coverage or name.

PaperYear / sessionQuestions in this viewOpen
Life Sciences (XL) 202420241View paper
Life Sciences (XL) 202320231View paper
Life Sciences (XL) 202220221View paper
Life Sciences (XL) 202120211View paper
Life Sciences (XL) 201920191View paper
Life Sciences (XL) 201620161View paper
Life Sciences (XL) 201520151View paper
Life Sciences (XL) 201220121View paper

Sample previous year questions

A varied preview from the papers represented in this selection, with every available option.

1
2012 · General Aptitude (GA) · Data Interpretation · Elementary Statistics
Life Sciences (XL) 2012

The data given in the following table summarizes the monthly budget of an average household.

CategoryAmount (Rs.)
Food4000
Clothing1200
Rent2000
Savings1500
Other expenses1800
The approximate percentage of the monthly budget NOT spent on savings is
Open complete paper
2
2015 · General Aptitude (GA) · Data Interpretation · Elementary Statistics
Life Sciences (XL) 2015
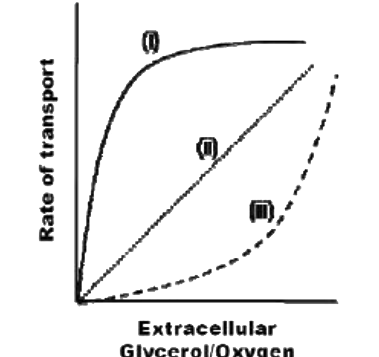
Which combination of profiles in the following figure accurately represents the transport rate of glycerol and oxygen into E. coli cells as a function of their extracellular concentration?

Question diagram

Open complete paper
3
2016 · General Aptitude (GA) · Data Interpretation · Elementary Statistics
Life Sciences (XL) 2016
The following graph represents the installed capacity for cement production (in tonnes) and the actual production (in tonnes) of nine cement plants of a cement company. Capacity utilization of a plant is defined as ratio of actual production of cement to installed capacity. A plant with installed capacity of at least 200 tonnes is called a large plant and a plant with lesser capacity is called a small plant. The difference between total production of large plants and small plants, in tonnes is ____.
Open complete paper
4
2019 · General Aptitude (GA) · Data Interpretation · Elementary Statistics
Life Sciences (XL) 2019
Mola is a digital platform for taxis in a city. It offers three types of rides – Pool, Mini and Prime. The Table below presents the number of rides for the past four months. The platform earns one US dollar per ride. What is the percentage share of revenue contributed by Prime to the total revenues of Mola, for the entire duration?

Question diagram

Open complete paper
5
2021 · General Aptitude (GA) · Data Interpretation · Elementary Statistics
Life Sciences (XL) 2021
The number of units of a product sold in three different years and the respective net profits are presented in the figure above. The cost/unit in Year 3 was 1, which was half the cost/unit in Year 2. The cost/unit in Year 3 was one-third of the cost/unit in Year 1. Taxes were paid on the selling price at 10%, 13% and 15% respectively for the three years. Net profit is calculated as the difference between the selling price and the sum of cost and taxes paid in that year.
The ratio of the selling price in Year 2 to the selling price in Year 3 is ________.
Open complete paper
6
2022 · General Aptitude (GA) · Data Interpretation · Elementary Statistics
Life Sciences (XL) 2022
A survey of 450 students about their subjects of interest resulted in the following outcome.
  • 150 students are interested in Mathematics.
  • 200 students are interested in Physics.
  • 175 students are interested in Chemistry.
  • 50 students are interested in Mathematics and Physics.
  • 60 students are interested in Physics and Chemistry.
  • 40 students are interested in Mathematics and Chemistry.
  • 30 students are interested in Mathematics, Physics and Chemistry.
  • Remaining students are interested in Humanities.
Based on the above information, the number of students interested in Humanities is
Open complete paper