My Cart
Your Cart 0

    Your cart is empty.

  • Total (Amount) ₹0.00
Previous year question hub

Measurement Standards, Errors and Uncertainty - Measurements - Instrumentation Engineering Previous Year Questions

Practice Measurement Standards, Errors and Uncertainty - Measurements - Instrumentation Engineering previous year questions organised from real papers, with year-wise coverage and clear topic navigation.

20Papers
17Years
51Questions
1Topics

Measurement Standards, Errors and Uncertainty question pattern

Every graph below is calculated only from this selection.

Questions by year

Year-wise coverage for Measurement Standards, Errors and Uncertainty. Each bar uses a separate theme-derived color.

Difficulty distribution

How the classified questions are distributed by difficulty.

Easy 30 58.8%
Medium 20 39.2%
Hard 1 2%
Question type distribution

MCQ, numerical, multiple-select and other formats found in these papers.

MCQ 34 66.7%
Numerical Answer Type (NAT) 12 23.5%
MSQ 4 7.8%
Fill in the blanks 1 2%

Subject weightage

Top subjects by unique question coverage.

Instrumentation Engineering
51 Qs

Most asked topics

Top topics across the included previous year papers.

Measurements
51 Qs

Subtopic coverage

Top subtopics inside this exact selection.

Measurement Standards, Errors and Uncertainty
51 Qs

Paper coverage

Question coverage for the most populated papers. Every active PYP paper remains listed below.

Instrumentation Engineering (IN) 2026
3 Qs
Instrumentation Engineering (IN) 2025
1 Qs
Instrumentation Engineering (IN) 2024
4 Qs
Instrumentation Engineering (IN) 2023
3 Qs
Instrumentation Engineering (IN) 2022
1 Qs
Instrumentation Engineering (IN) 2021
2 Qs
Instrumentation Engineering (IN) 2020
2 Qs
Instrumentation Engineering (IN) 2019
3 Qs
Instrumentation Engineering (IN) 2018
2 Qs
Instrumentation Engineering (IN) 2016
2 Qs
Instrumentation Engineering (IN) 2014
3 Qs
Instrumentation Engineering (IN) 2013 [Session 4]
3 Qs
Instrumentation Engineering (IN) 2013 [Session 2]
2 Qs
Instrumentation Engineering (IN) 2013 [Session 3]
2 Qs
Instrumentation Engineering (IN) 2013 [Session 1]
1 Qs
Instrumentation Engineering (IN) 2011
2 Qs
Instrumentation Engineering (IN) 2010
6 Qs
Instrumentation Engineering (IN) 2009
4 Qs
Instrumentation Engineering (IN) 2008
2 Qs
Instrumentation Engineering (IN) 2007
3 Qs

Included previous year papers

Newest papers appear first. Sort by year, question coverage or name.

PaperYear / sessionQuestions in this viewOpen
Instrumentation Engineering (IN) 202620263View paper
Instrumentation Engineering (IN) 202520251View paper
Instrumentation Engineering (IN) 202420244View paper
Instrumentation Engineering (IN) 202320233View paper
Instrumentation Engineering (IN) 202220221View paper
Instrumentation Engineering (IN) 202120212View paper
Instrumentation Engineering (IN) 202020202View paper
Instrumentation Engineering (IN) 201920193View paper
Instrumentation Engineering (IN) 201820182View paper
Instrumentation Engineering (IN) 201620162View paper
Instrumentation Engineering (IN) 201420143View paper
Instrumentation Engineering (IN) 2013 [Session 1]20131View paper
Instrumentation Engineering (IN) 2013 [Session 2]20132View paper
Instrumentation Engineering (IN) 2013 [Session 3]20132View paper
Instrumentation Engineering (IN) 2013 [Session 4]20133View paper
Instrumentation Engineering (IN) 201120112View paper
Instrumentation Engineering (IN) 201020106View paper
Instrumentation Engineering (IN) 200920094View paper
Instrumentation Engineering (IN) 200820082View paper
Instrumentation Engineering (IN) 200720073View paper

All Measurement Standards, Errors and Uncertainty previous year questions

Practice every matching question in batches of 20, with every available option.

1
2009 · Instrumentation Engineering · Measurements · Measurement Standards, Errors and Uncertainty
Instrumentation Engineering (IN) 2009
Assuming complete dissociation, the pH of a 1 mM solution of H₂SO₄ is closest to
Open complete paper
2
2009 · Instrumentation Engineering · Measurements · Measurement Standards, Errors and Uncertainty
Instrumentation Engineering (IN) 2009
A quantity x is calculated by using the formula x = (p − q)/r. The measured values are p = 9, q = 6, r = 0.5. Assume that the measurement errors in p, q and r are independent. The absolute maximum error in the measurement of each of the three quantities is ε. The absolute maximum error in the calculated value of x is
Open complete paper
3
2009 · Instrumentation Engineering · Measurements · Measurement Standards, Errors and Uncertainty
Instrumentation Engineering (IN) 2009
The response of a first order measurement system to a unit step input is \(1 - e^{-0.5t}\), where \(t\) is in seconds. A ramp of 0.1 units per second is given as the input to this system. The error in the measured value after transients have died down is
Open complete paper
4
2009 · Instrumentation Engineering · Measurements · Measurement Standards, Errors and Uncertainty
Instrumentation Engineering (IN) 2009
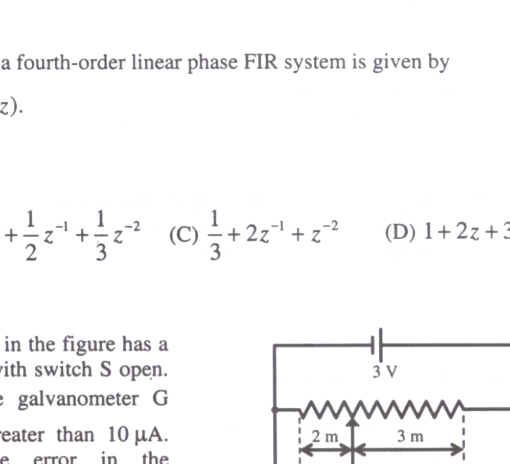
The dc potentiometer shown in the figure has a working current of 10 mA with switch S open. Let \(R_2 + R_1 = 100 \Omega\). The galvanometer G can only detect currents greater than 10 \(\mu\)A. The maximum percentage error in the measurement of the unknown emf \(E_x\), as calculated from the slider position shown is closest to

Question diagram

Open complete paper
5
2010 · Instrumentation Engineering · Measurements · Measurement Standards, Errors and Uncertainty
Instrumentation Engineering (IN) 2010

A person weighing 60 kg receives radiation energy of 0.3 J over the entire body. The dose of radiation absorbed (in rad) is

Open complete paper
6
2010 · Instrumentation Engineering · Measurements · Measurement Standards, Errors and Uncertainty
Instrumentation Engineering (IN) 2010
A measurement system with input \( x(t) \) and output \( y(t) \) is described by the differential equation \( 3 \frac{dy}{dt} + 5y = 8x \). The static sensitivity of the system is
Open complete paper
7
2010 · Instrumentation Engineering · Measurements · Measurement Standards, Errors and Uncertainty
Instrumentation Engineering (IN) 2010
Match the following
Open complete paper
8
2010 · Instrumentation Engineering · Measurements · Measurement Standards, Errors and Uncertainty
Instrumentation Engineering (IN) 2010

The output voltage of a transducer with an output resistance of 10 kΩ is connected to an amplifier. The minimum input resistance of the amplifier so that the error in recording the transducer output does not exceed 2% is

Open complete paper
9
2010 · Instrumentation Engineering · Measurements · Measurement Standards, Errors and Uncertainty
Instrumentation Engineering (IN) 2010

The volume of a cylinder is computed from measurements of its height (h) and diameter (d). A set of several measurements of height has an average value of 0.2 m and a standard deviation of 1%. The average value obtained for the diameter is 0.1 m and the standard deviation is 1%. Assuming the errors in the measurements of height and diameter are uncorrelated, the standard deviation of the computed volume is

Open complete paper
10
2010 · Instrumentation Engineering · Measurements · Measurement Standards, Errors and Uncertainty
Instrumentation Engineering (IN) 2010
A solution “P” is put in a spectrophotometer cuvette of optical path length 1 cm. The transmittance is found to be 10%. Another solution “Q” has a transmittance of 40% under the same circumstances. If equal volumes of P and Q are mixed together, the transmittance of the resulting solution (assuming the constituents of P and Q do not react with each other) is, approximately,
Open complete paper
11
2011 · Instrumentation Engineering · Measurements · Measurement Standards, Errors and Uncertainty
Instrumentation Engineering (IN) 2011

When the floating detector is at the level calculated in Q.52, the time elapsed is

Open complete paper
12
2011 · Instrumentation Engineering · Measurements · Measurement Standards, Errors and Uncertainty
Instrumentation Engineering (IN) 2011
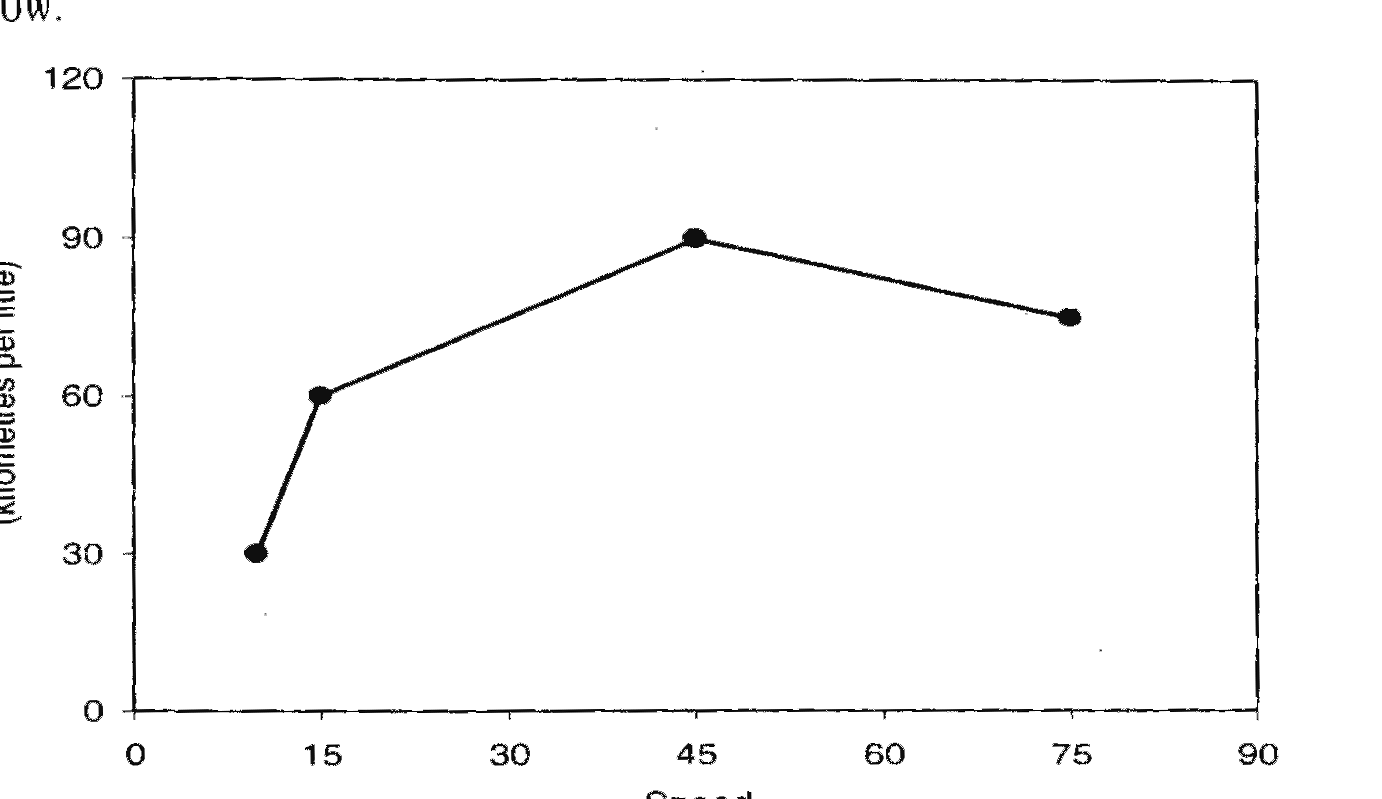
The fuel consumed by a motorcycle during a journey while traveling at various speeds is indicated in the graph below.

The distances covered during four laps of the journey are listed in the table below

From the given data, we can conclude that the fuel consumed per kilometre was least during the lap
Open complete paper
13
2013 · Instrumentation Engineering · Measurements · Measurement Standards, Errors and Uncertainty
Instrumentation Engineering (IN) 2013 [Session 1]
Two ammeters \(A_1\) and \(A_2\) measure the same current and provide readings \(I_1\) and \(I_2\) respectively. The ammeter errors can be characterized as independent zero mean Gaussian random variables of standard deviations \(\sigma_1\) and \(\sigma_2\), respectively. The value of the current is computed as : \(I = \mu I_1 + (1-\mu) I_2\) The value of \(\mu\) which gives the lowest standard deviation of \(I\) is
Open complete paper
14
2013 · Instrumentation Engineering · Measurements · Measurement Standards, Errors and Uncertainty
Instrumentation Engineering (IN) 2013 [Session 2]
Two ammeters $A_1$ and $A_2$ measure the same current and provide readings $I_1$ and $I_2$, respectively. The ammeter errors can be characterized as independent zero mean Gaussian random variables of standard deviations $\sigma_1$ and $\sigma_2$, respectively. The value of the current is computed as : $I = \mu I_1 + (1-\mu) I_2$. The value of $\mu$ which gives the lowest standard deviation of $I$ is
Open complete paper
15
2013 · Instrumentation Engineering · Measurements · Measurement Standards, Errors and Uncertainty
Instrumentation Engineering (IN) 2013 [Session 2]
Measurement of optical absorption of a solution is disturbed by the additional stray light falling at the photo-detector. For estimation of the error caused by stray light the following data could be obtained from controlled experiments. Photo-detector output without solution and without stray light is 500 μW. Photo-detector output without solution and with stray light is 600 μW. Photo-detector output with solution and with stray light is 200 μW. The percent error in computing absorption coefficient due to stray light is
Open complete paper
16
2013 · Instrumentation Engineering · Measurements · Measurement Standards, Errors and Uncertainty
Instrumentation Engineering (IN) 2013 [Session 3]
Measurement of optical absorption of a solution is disturbed by the additional stray light falling at the photo-detector. For estimation of the error caused by stray light the following data could be obtained from controlled experiments.
Photo-detector output without solution and without stray light is 500 \( \mu \)W.
Photo-detector output without solution and with stray light is 600 \( \mu \)W.
Photo-detector output with solution and with stray light is 200 \( \mu \)W.
The percent error in computing absorption coefficient due to stray light is
Open complete paper
17
2013 · Instrumentation Engineering · Measurements · Measurement Standards, Errors and Uncertainty
Instrumentation Engineering (IN) 2013 [Session 3]
Two ammeters \( A_1 \) and \( A_2 \) measure the same current and provide readings \( I_1 \) and \( I_2 \), respectively. The ammeter errors can be characterized as independent zero mean Gaussian random variables of standard deviations \( \sigma_1 \) and \( \sigma_2 \), respectively. The value of the current is computed as :
\( I = \mu I_1 + (1-\mu)I_2 \)
The value of \( \mu \) which gives the lowest standard deviation of \( I \) is
Open complete paper
18
2013 · Instrumentation Engineering · Measurements · Measurement Standards, Errors and Uncertainty
Instrumentation Engineering (IN) 2013 [Session 4]
Measurement of optical absorption of a solution is disturbed by the additional stray light falling at the photo-detector. For estimation of the error caused by stray light the following data could be obtained from controlled experiments.
Photo-detector output without solution and without stray light is 500 $\mu$ W.
Photo-detector output without solution and with stray light is 600 $\mu$ W.
Photo-detector output with solution and with stray light is 200 $\mu$ W.
The percent error in computing absorption coefficient due to stray light is
Open complete paper
19
2013 · Instrumentation Engineering · Measurements · Measurement Standards, Errors and Uncertainty
Instrumentation Engineering (IN) 2013 [Session 4]
Two ammeters $A_1$ and $A_2$ measure the same current and provide readings $I_1$ and $I_2$, respectively. The ammeter errors can be characterized as independent zero mean Gaussian random variables of standard deviations $\sigma_1$ and $\sigma_2$, respectively. The value of the current is computed as :
$I = \mu I_1 + (1-\mu) I_2$
The value of $\mu$ which gives the lowest standard deviation of $I$ is
Open complete paper
20
2013 · Instrumentation Engineering · Measurements · Measurement Standards, Errors and Uncertainty
Instrumentation Engineering (IN) 2013 [Session 4]
The minimum frequency of a force signal in Hz within its useful mid-band range of measurement, for which the gain amplitude is more than 0.95, approximately is,
Open complete paper

Showing 20 of 51 questions