My Cart
Your Cart 0

    Your cart is empty.

  • Total (Amount) ₹0.00
Previous year question hub

Digital Meters, Oscilloscopes and Spectrum Analysis - Measurements - Instrumentation Engineering Previous Year Questions

Practice Digital Meters, Oscilloscopes and Spectrum Analysis - Measurements - Instrumentation Engineering previous year questions organised from real papers, with year-wise coverage and clear topic navigation.

16Papers
15Years
31Questions
1Topics

Digital Meters, Oscilloscopes and Spectrum Analysis question pattern

Every graph below is calculated only from this selection.

Questions by year

Year-wise coverage for Digital Meters, Oscilloscopes and Spectrum Analysis. Each bar uses a separate theme-derived color.

Difficulty distribution

How the classified questions are distributed by difficulty.

Medium 19 61.3%
Easy 11 35.5%
Hard 1 3.2%
Question type distribution

MCQ, numerical, multiple-select and other formats found in these papers.

MCQ 19 61.3%
Numerical Answer Type (NAT) 10 32.3%
MSQ 1 3.2%
Fill in the blanks 1 3.2%

Subject weightage

Top subjects by unique question coverage.

Instrumentation Engineering
31 Qs

Most asked topics

Top topics across the included previous year papers.

Measurements
31 Qs

Subtopic coverage

Top subtopics inside this exact selection.

Digital Meters, Oscilloscopes and Spectrum Analysis
31 Qs

Paper coverage

Question coverage for the most populated papers. Every active PYP paper remains listed below.

Instrumentation Engineering (IN) 2026
2 Qs
Instrumentation Engineering (IN) 2025
2 Qs
Instrumentation Engineering (IN) 2024
1 Qs
Instrumentation Engineering (IN) 2023
1 Qs
Instrumentation Engineering (IN) 2021
4 Qs
Instrumentation Engineering (IN) 2020
1 Qs
Instrumentation Engineering (IN) 2018
2 Qs
Instrumentation Engineering (IN) 2017
1 Qs
Instrumentation Engineering (IN) 2016
2 Qs
Instrumentation Engineering (IN) 2014
2 Qs
Instrumentation Engineering (IN) 2013 [Session 1]
1 Qs
Instrumentation Engineering (IN) 2013 [Session 3]
1 Qs
Instrumentation Engineering (IN) 2010
3 Qs
Instrumentation Engineering (IN) 2009
4 Qs
Instrumentation Engineering (IN) 2008
1 Qs
Instrumentation Engineering (IN) 2007
3 Qs

Included previous year papers

Newest papers appear first. Sort by year, question coverage or name.

PaperYear / sessionQuestions in this viewOpen
Instrumentation Engineering (IN) 202620262View paper
Instrumentation Engineering (IN) 202520252View paper
Instrumentation Engineering (IN) 202420241View paper
Instrumentation Engineering (IN) 202320231View paper
Instrumentation Engineering (IN) 202120214View paper
Instrumentation Engineering (IN) 202020201View paper
Instrumentation Engineering (IN) 201820182View paper
Instrumentation Engineering (IN) 201720171View paper
Instrumentation Engineering (IN) 201620162View paper
Instrumentation Engineering (IN) 201420142View paper
Instrumentation Engineering (IN) 2013 [Session 1]20131View paper
Instrumentation Engineering (IN) 2013 [Session 3]20131View paper
Instrumentation Engineering (IN) 201020103View paper
Instrumentation Engineering (IN) 200920094View paper
Instrumentation Engineering (IN) 200820081View paper
Instrumentation Engineering (IN) 200720073View paper

All Digital Meters, Oscilloscopes and Spectrum Analysis previous year questions

Practice every matching question in batches of 20, with every available option.

1
2009 · Instrumentation Engineering · Measurements · Digital Meters, Oscilloscopes and Spectrum Analysis
Instrumentation Engineering (IN) 2009
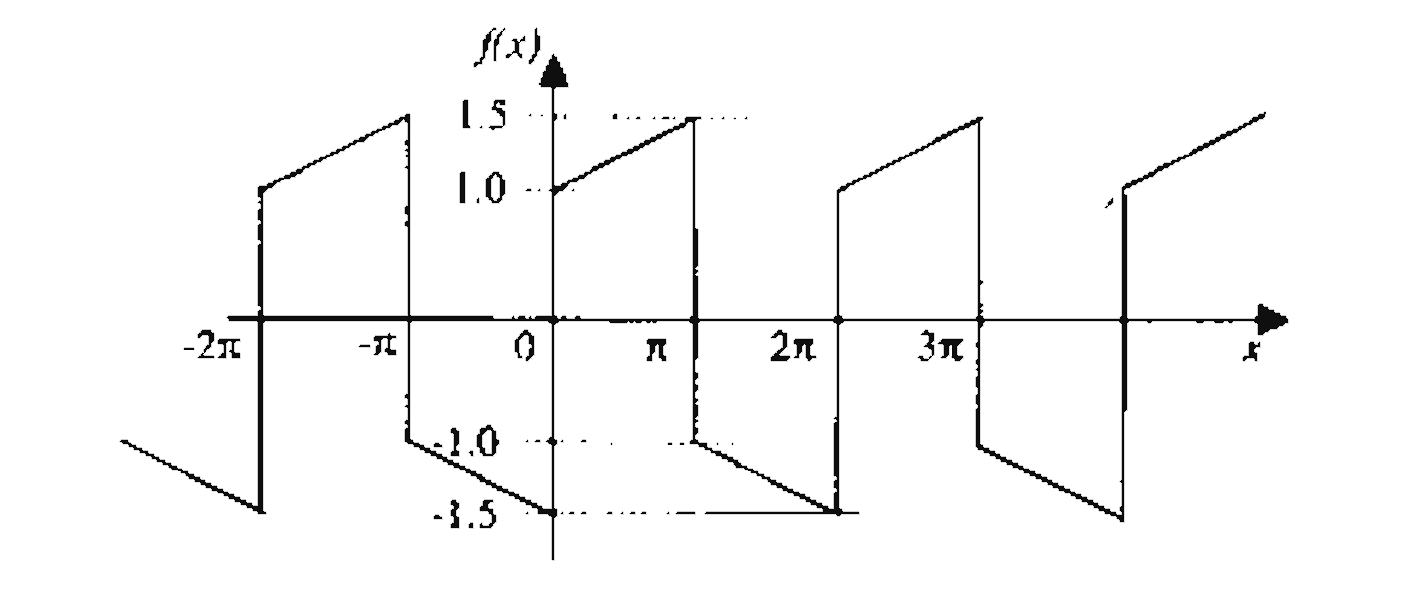
The figure shows a periodic waveform to be displayed on a CRO. A trigger setting which ensures a stationary display is
Open complete paper
2
2009 · Instrumentation Engineering · Measurements · Digital Meters, Oscilloscopes and Spectrum Analysis
Instrumentation Engineering (IN) 2009

The input impedance of a CRO is equivalent to a 1 MΩ resistance in parallel with a 45 pF capacitance. It is used with a compensated 10-to-1 attenuation probe. The effective input capacitance at the probe tip is

Open complete paper
3
2009 · Instrumentation Engineering · Measurements · Digital Meters, Oscilloscopes and Spectrum Analysis
Instrumentation Engineering (IN) 2009

A galvanometer with internal resistance 100 Ω and full-scale current 1 mA is used to realize a dc voltmeter with a full scale range of 1 V. The full scale range of this voltmeter can be extended to 10 V by connecting an external resistance of value

Open complete paper
4
2009 · Instrumentation Engineering · Measurements · Digital Meters, Oscilloscopes and Spectrum Analysis
Instrumentation Engineering (IN) 2009
A stroboscopic system is used for measuring the speed of a rotating shaft. The shaft has one target mark on it. The maximum strobe rate at which synchronism is achieved is \(r_1\) flashes per minute. The next lower flash rate at which synchronism is achieved is \(r_2\) flashes per minute. The speed of the shaft in rpm is
Open complete paper
5
2010 · Instrumentation Engineering · Measurements · Digital Meters, Oscilloscopes and Spectrum Analysis
Instrumentation Engineering (IN) 2010

The PMMC ammeter A in the adjoining figure has a range of 0 to 3 mA. When switch S1 is opened, the pointer of the ammeter swings to the 1 mA mark, returns and settles at 0.9 mA. The meter is

Open complete paper
6
2010 · Instrumentation Engineering · Measurements · Digital Meters, Oscilloscopes and Spectrum Analysis
Instrumentation Engineering (IN) 2010
The deflection angle of the pointer of an ideal moving iron ammeter is \(20^\circ\) for 1.0 ampere dc current. If a current of \(3 \sin(314t)\) amperes is passed through the ammeter then the deflection angle is
Open complete paper
7
2010 · Instrumentation Engineering · Measurements · Digital Meters, Oscilloscopes and Spectrum Analysis
Instrumentation Engineering (IN) 2010
In an analog single channel cathode ray oscilloscope (CRO), the x and y sensitivities are set as 1 ms/div. and 1 V/div, respectively. The y-input is connected to a voltage signal 4 cos (200πt - 45°) V. The trigger source is internal, level chosen is zero and the slope is positive. The display seen on the CRO screen is
Open complete paper
8
2013 · Instrumentation Engineering · Measurements · Digital Meters, Oscilloscopes and Spectrum Analysis
Instrumentation Engineering (IN) 2013 [Session 1]

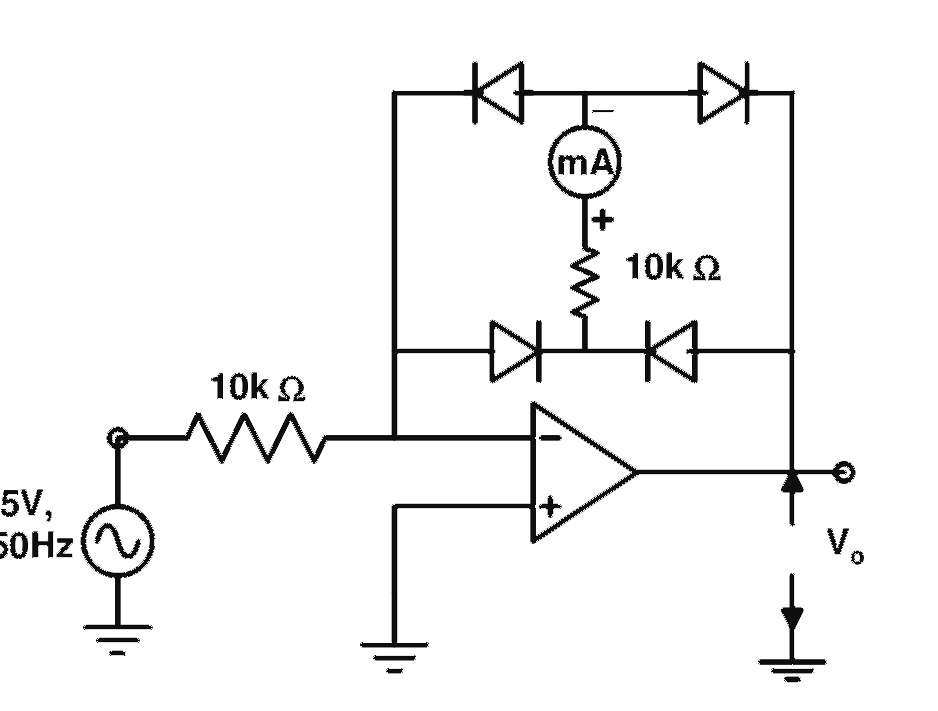
The circuit below incorporates a permanent magnet moving coil milli-ammeter of range 1 mA having a series resistance of 10 kΩ. Assuming constant diode forward resistance of 50 Ω, a forward diode drop of 0.7 V and infinite reverse diode resistance for each diode, the reading of the meter in mA is

Open complete paper
9
2013 · Instrumentation Engineering · Measurements · Digital Meters, Oscilloscopes and Spectrum Analysis
Instrumentation Engineering (IN) 2013 [Session 3]
The circuit below incorporates a permanent magnet moving coil milli-ammeter of range 1 mA having a series resistance of 10 k\( \Omega \). Assuming constant diode forward resistance of 50 \( \Omega \), a forward diode drop of 0.7 V and infinite reverse diode resistance for each diode, the reading of the meter in mA is
Open complete paper
10
2014 · Instrumentation Engineering · Measurements · Digital Meters, Oscilloscopes and Spectrum Analysis
Instrumentation Engineering (IN) 2014
In a time-of-flight mass spectrometer, \(q\) is the charge and \(m\) the mass of the ionized species, then the time of flight is proportional to
Open complete paper
11
2014 · Instrumentation Engineering · Measurements · Digital Meters, Oscilloscopes and Spectrum Analysis
Instrumentation Engineering (IN) 2014

Frequency of an analog periodic signal in the range of 5kHz - 10kHz is to be measured with a resolution of 100Hz by measuring its period with a counter. Assuming negligible signal and transition delays the minimum clock frequency and minimum number of bits in the counter needed, respectively, are:

Open complete paper
12
2016 · Instrumentation Engineering · Measurements · Digital Meters, Oscilloscopes and Spectrum Analysis
Instrumentation Engineering (IN) 2016
The comparators (output = '1', when input \(\ge\) 0 and output = '0', when input < 0), exclusive-OR gate and the unity gain low-pass filter given in the circuit are ideal. The logic output voltages of the exclusive-OR gate are 0 V and 5 V. The cutoff frequency of the low-pass filter is 0.1 Hz. For \(V_1 = 1 \sin (3000t + 36°)\) V and \(V_2 = 1 \sin (3000t)\) V, the value of \(V_o\) in volt is ______.

Question diagram

Open complete paper
13
2016 · Instrumentation Engineering · Measurements · Digital Meters, Oscilloscopes and Spectrum Analysis
Instrumentation Engineering (IN) 2016
A 200 mV full scale dual-slope \(3\frac{1}{2}\) digit DMM has a reference voltage of 100 mV and a first integration time of 100 ms. For an input of \([100 + 10 \cos(100\pi t)]\) mV, the conversion time (without taking the auto-zero phase time into consideration) in millisecond is ______.
Open complete paper
14
2024 · Instrumentation Engineering · Measurements · Digital Meters, Oscilloscopes and Spectrum Analysis
Instrumentation Engineering (IN) 2024
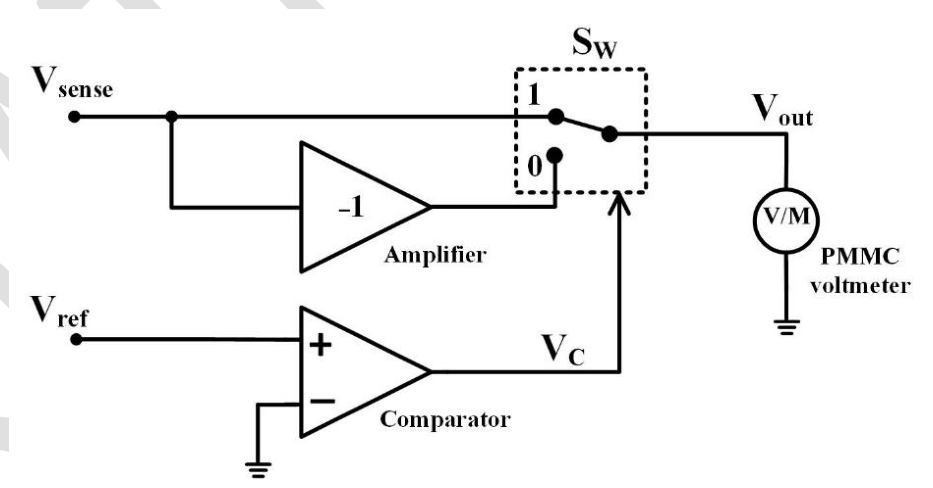
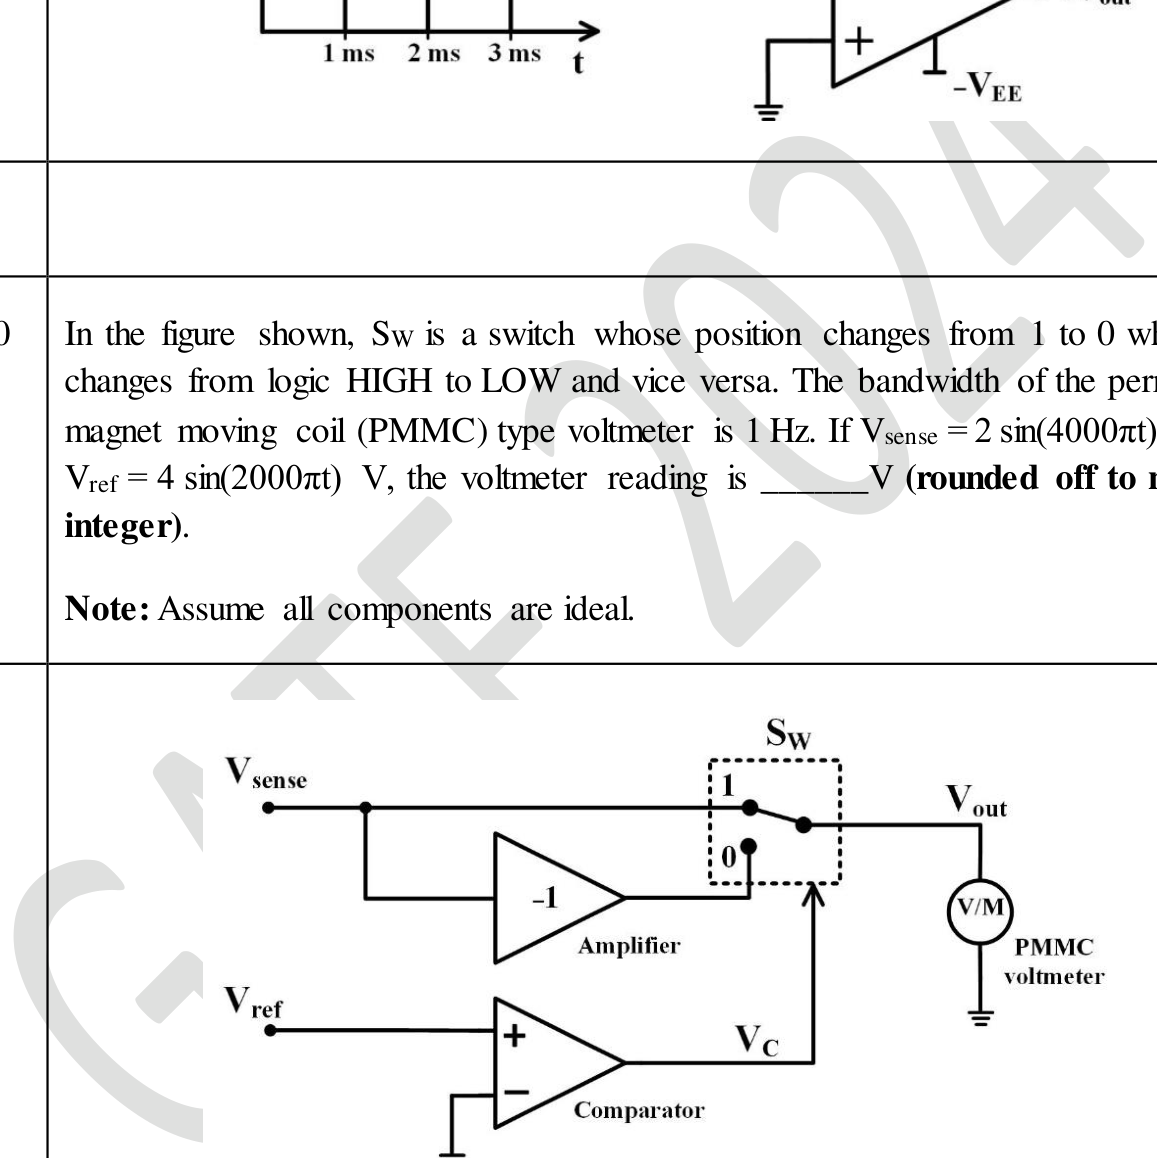
In the figure shown, Sw is a switch whose position changes from 1 to 0 when Vc changes from logic HIGH to LOW and vice versa. The bandwidth of the permanent magnet moving coil (PMMC) type voltmeter is 1 Hz. If Vsense = 2 sin(4000πt) V and Vref = 4 sin(2000πt) V, the voltmeter reading is _____ V (rounded off to nearest integer).
Note: Assume all components are ideal.

Source question diagram

Source question diagram

Open complete paper
15
2025 · Instrumentation Engineering · Measurements · Digital Meters, Oscilloscopes and Spectrum Analysis
Instrumentation Engineering (IN) 2025
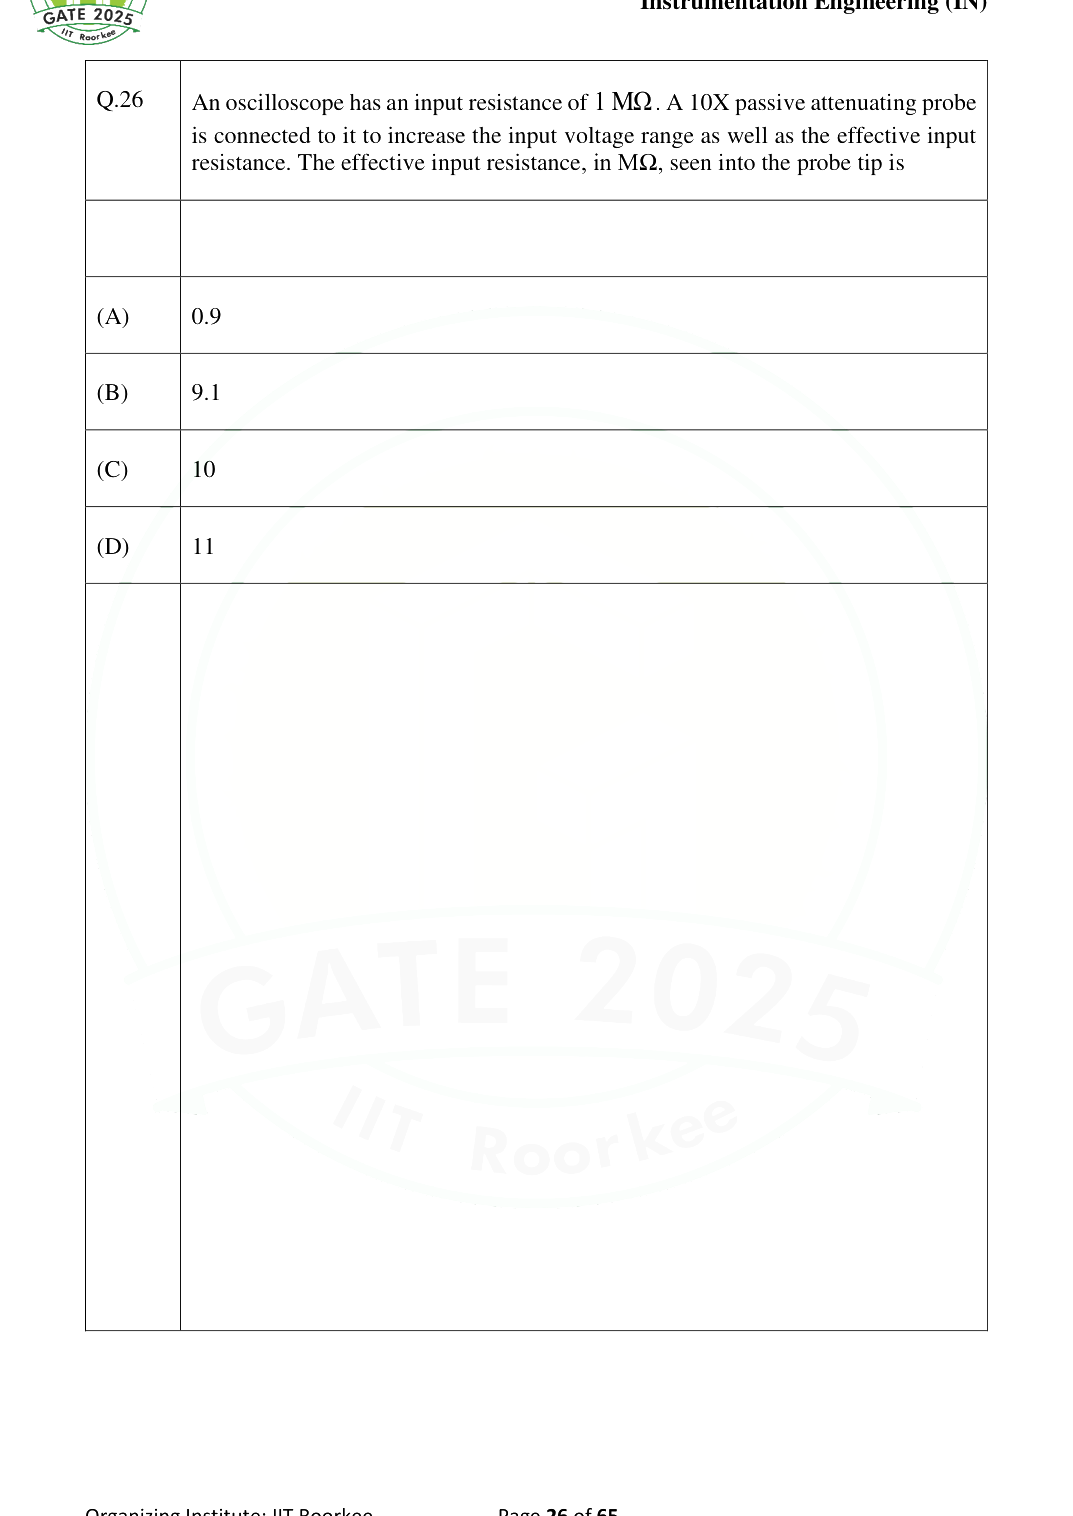
An oscilloscope has an input resistance of \( 1 \text{ M}\Omega \). A 10X passive attenuating probe is connected to it to increase the input voltage range as well as the effective input resistance. The effective input resistance, in \( \text{M}\Omega \), seen into the probe tip is

Question diagram

Open complete paper
16
2025 · Instrumentation Engineering · Measurements · Digital Meters, Oscilloscopes and Spectrum Analysis
Instrumentation Engineering (IN) 2025

A dual-slope ADC has a fixed integration time of 100 ms. The reference voltage of the ADC is −5 V. The time taken by the ADC to measure an input voltage of 1.25 V is ________ ms (rounded off to the nearest integer).

Open complete paper
17
2007 · Instrumentation Engineering · Measurements · Digital Meters, Oscilloscopes and Spectrum Analysis
Instrumentation Engineering (IN) 2007
A dynamometer type wattmeter with a single scale marked for the smallest power range, has two current ranges, namely, 0-5 A and 0-10 A as well as two voltage ranges, namely, 0-150 V and 0-300 V. To carry out a load test on a 230 V / 115 V, 1kVA, single phase transformer, the wattmeter is used on the high voltage side. The voltage and current ranges are chosen for maximum utilization of the scale. The multiplying factor to be used in this case is
Open complete paper
18
2007 · Instrumentation Engineering · Measurements · Digital Meters, Oscilloscopes and Spectrum Analysis
Instrumentation Engineering (IN) 2007
The pulse width \( T \) of an asynchronous pulse is measured by a counter with an edge-triggered clock of known frequency \( f_c \) as shown in the figure below:

The pulse, whose width is to be measured, is applied to the Enable pin of the counter. The counter counts while the Enable is high and is held reset to zero otherwise. The counter output is latched by the negative edge of the Enable signal. The measured pulse width is taken to be \( N \) times the clock period, where \( N \) is the count reached at the end of a count cycle.

Assuming no overflow, the measurement error will be limited to \( x\% \) of \( T \) if
Open complete paper
19
2007 · Instrumentation Engineering · Measurements · Digital Meters, Oscilloscopes and Spectrum Analysis
Instrumentation Engineering (IN) 2007
Two signals of peak-to-peak voltages 5 V and 2 V are being fed to Channel 1 and Channel 2, respectively, of an oscilloscope with a single time base. The vertical sensitivity of both channels is 1 V/division. The two sine waves have identical frequency and phase. The trigger is on manual mode and triggers at a level of +1.25 V on Channel 1, as shown in the figure below:

Which of the following figures correctly depicts the trace seen in Channel 2?
Open complete paper
20
2008 · Instrumentation Engineering · Measurements · Digital Meters, Oscilloscopes and Spectrum Analysis
Instrumentation Engineering (IN) 2008
If a current of \( \left[ -6\sqrt{2}\sin(100\pi t) + 6\sqrt{2}\cos(300\pi t + \frac{\pi}{4}) + 6\sqrt{2} \right] \) A is passed through a true RMS ammeter, the meter reading will be
Open complete paper

Showing 20 of 31 questions