My Cart
Your Cart 0

    Your cart is empty.

  • Total (Amount) ₹0.00
Previous year question hub

Data Interpretation - General Aptitude (GA) Previous Year Questions

Practice Data Interpretation - General Aptitude (GA) previous year questions organised from real papers, with year-wise coverage and clear topic navigation.

7Papers
7Years
8Questions
1Topics

Data Interpretation question pattern

Every graph below is calculated only from this selection.

Questions by year

Year-wise coverage for Data Interpretation. Each bar uses a separate theme-derived color.

Difficulty distribution

How the classified questions are distributed by difficulty.

Easy 4 50%
Medium 3 37.5%
Hard 1 12.5%
Question type distribution

MCQ, numerical, multiple-select and other formats found in these papers.

MCQ 7 87.5%
Numerical Answer Type (NAT) 1 12.5%

Subject weightage

Top subjects by unique question coverage.

General Aptitude (GA)
8 Qs

Most asked topics

Top topics across the included previous year papers.

Data Interpretation
8 Qs

Subtopic coverage

Top subtopics inside this exact selection.

Elementary Statistics
8 Qs

Paper coverage

Question coverage for the most populated papers. Every active PYP paper remains listed below.

Instrumentation Engineering (IN) 2024
1 Qs
Instrumentation Engineering (IN) 2023
1 Qs
Instrumentation Engineering (IN) 2020
1 Qs
Instrumentation Engineering (IN) 2016
1 Qs
Instrumentation Engineering (IN) 2015
1 Qs
Instrumentation Engineering (IN) 2014
1 Qs
Instrumentation Engineering (IN) 2012
2 Qs

Browse by subtopics

Open a focused page built from the same verified paper data.

Included previous year papers

Newest papers appear first. Sort by year, question coverage or name.

PaperYear / sessionQuestions in this viewOpen
Instrumentation Engineering (IN) 202420241View paper
Instrumentation Engineering (IN) 202320231View paper
Instrumentation Engineering (IN) 202020201View paper
Instrumentation Engineering (IN) 201620161View paper
Instrumentation Engineering (IN) 201520151View paper
Instrumentation Engineering (IN) 201420141View paper
Instrumentation Engineering (IN) 201220122View paper

Sample previous year questions

A varied preview from the papers represented in this selection, with every available option.

1
2012 · General Aptitude (GA) · Data Interpretation · Elementary Statistics
Instrumentation Engineering (IN) 2012

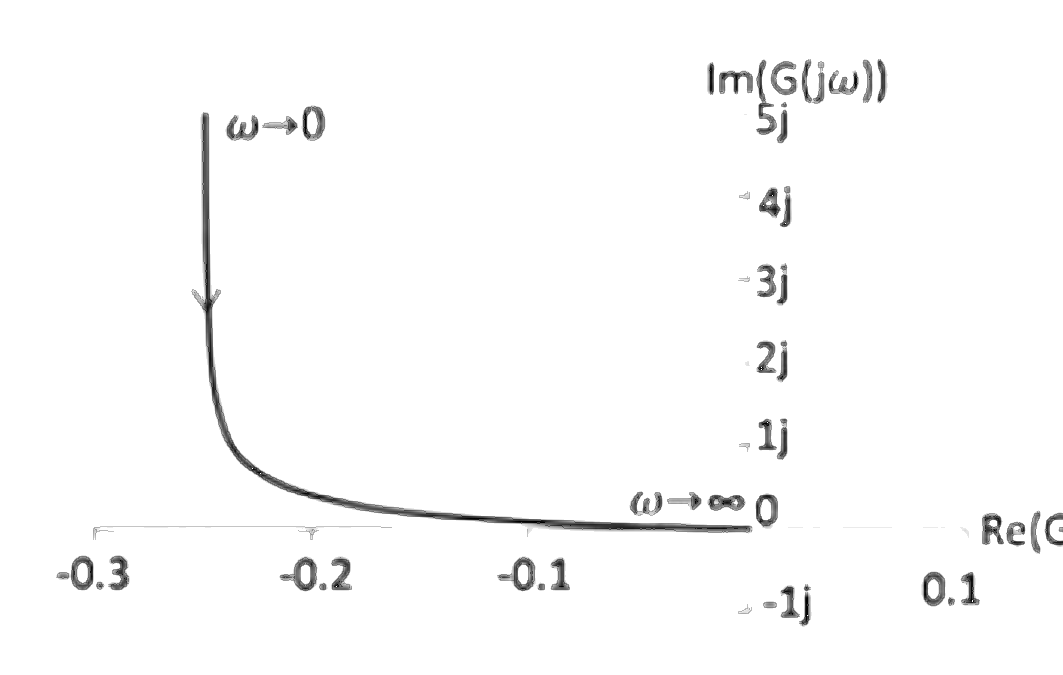
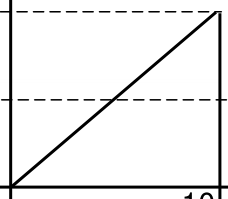
A periodic voltage waveform observed on an oscilloscope across a load is shown. A permanent magnet moving coil (PMMC) meter connected across the same load reads

Source question diagram

Open complete paper
2
2014 · General Aptitude (GA) · Data Interpretation · Elementary Statistics
Instrumentation Engineering (IN) 2014
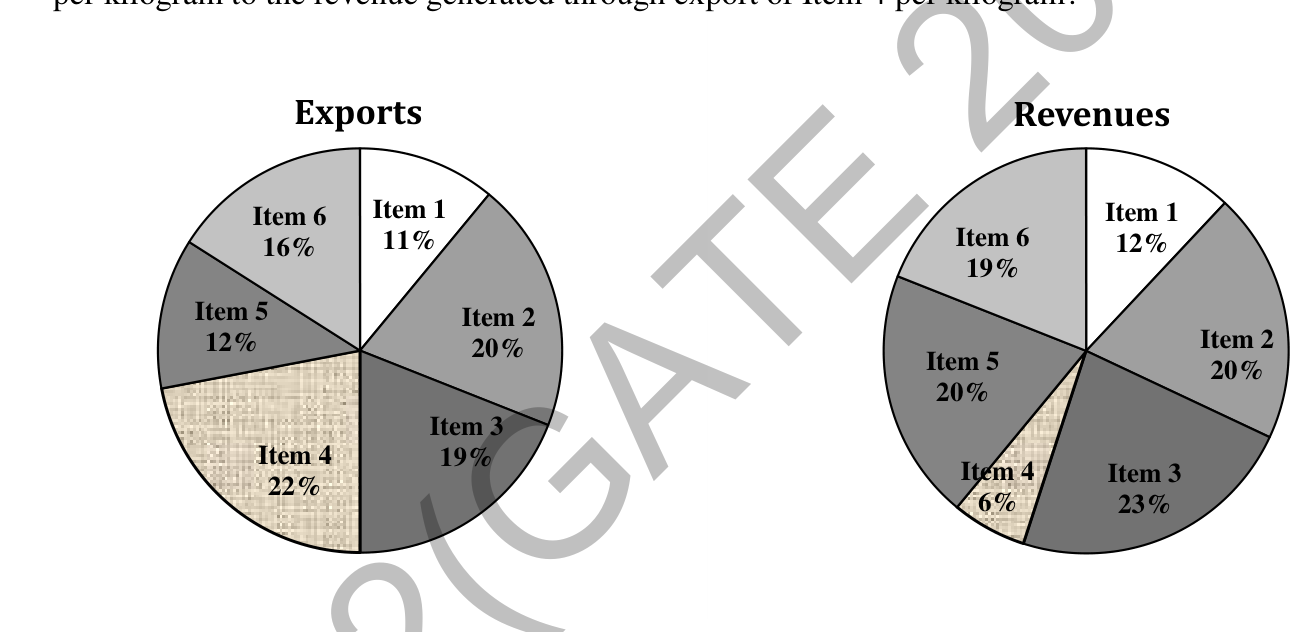
The total exports and revenues from the exports of a country are given in the two pie charts below. The pie chart for exports shows the quantity of each item as a percentage of the total quantity of exports. The pie chart for the revenues shows the percentage of the total revenue generated through export of each item. The total quantity of exports of all the items is 5 lakh tonnes and the total revenues are 250 crore rupees. What is the ratio of the revenue generated through export of Item 1 per kilogram to the revenue generated through export of Item 4 per kilogram?

Source question diagram

Open complete paper
3
2015 · General Aptitude (GA) · Data Interpretation · Elementary Statistics
Instrumentation Engineering (IN) 2015
In the circuit shown in the figure, both the NMOS transistors are identical with their threshold voltages being 5 V. Ignoring channel length modulation, the output voltage \( V_{out} \) in volt is __________ V.
Open complete paper
4
2016 · General Aptitude (GA) · Data Interpretation · Elementary Statistics
Instrumentation Engineering (IN) 2016
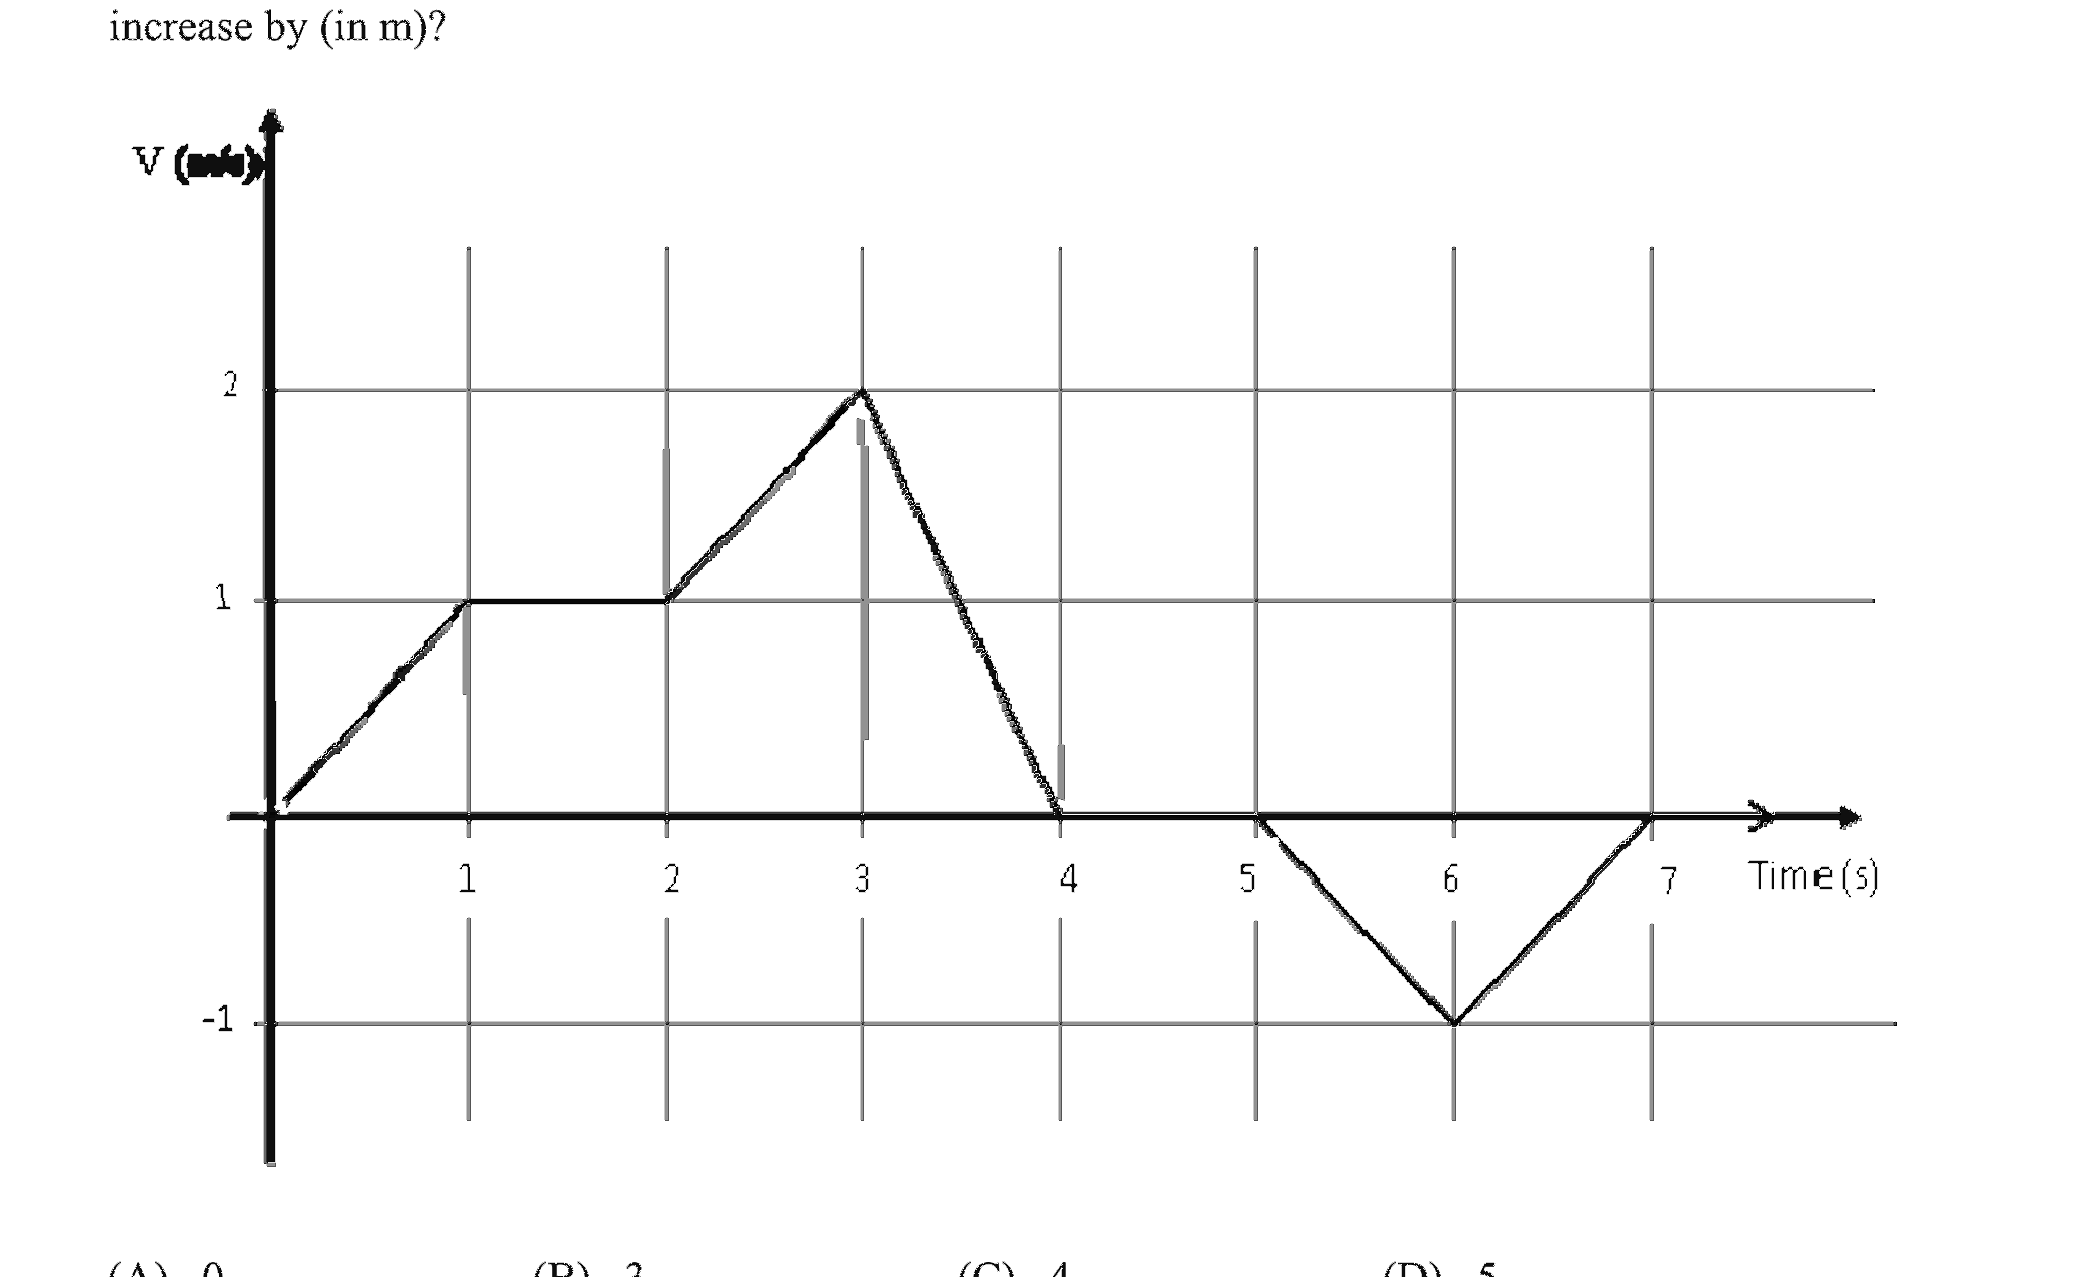
The velocity V of a vehicle along a straight line is measured in m/s and plotted as shown with respect to time in seconds. At the end of the 7 seconds, how much will the odometer reading increase by (in m)?
Open complete paper
5
2024 · General Aptitude (GA) · Data Interpretation · Elementary Statistics
Instrumentation Engineering (IN) 2024

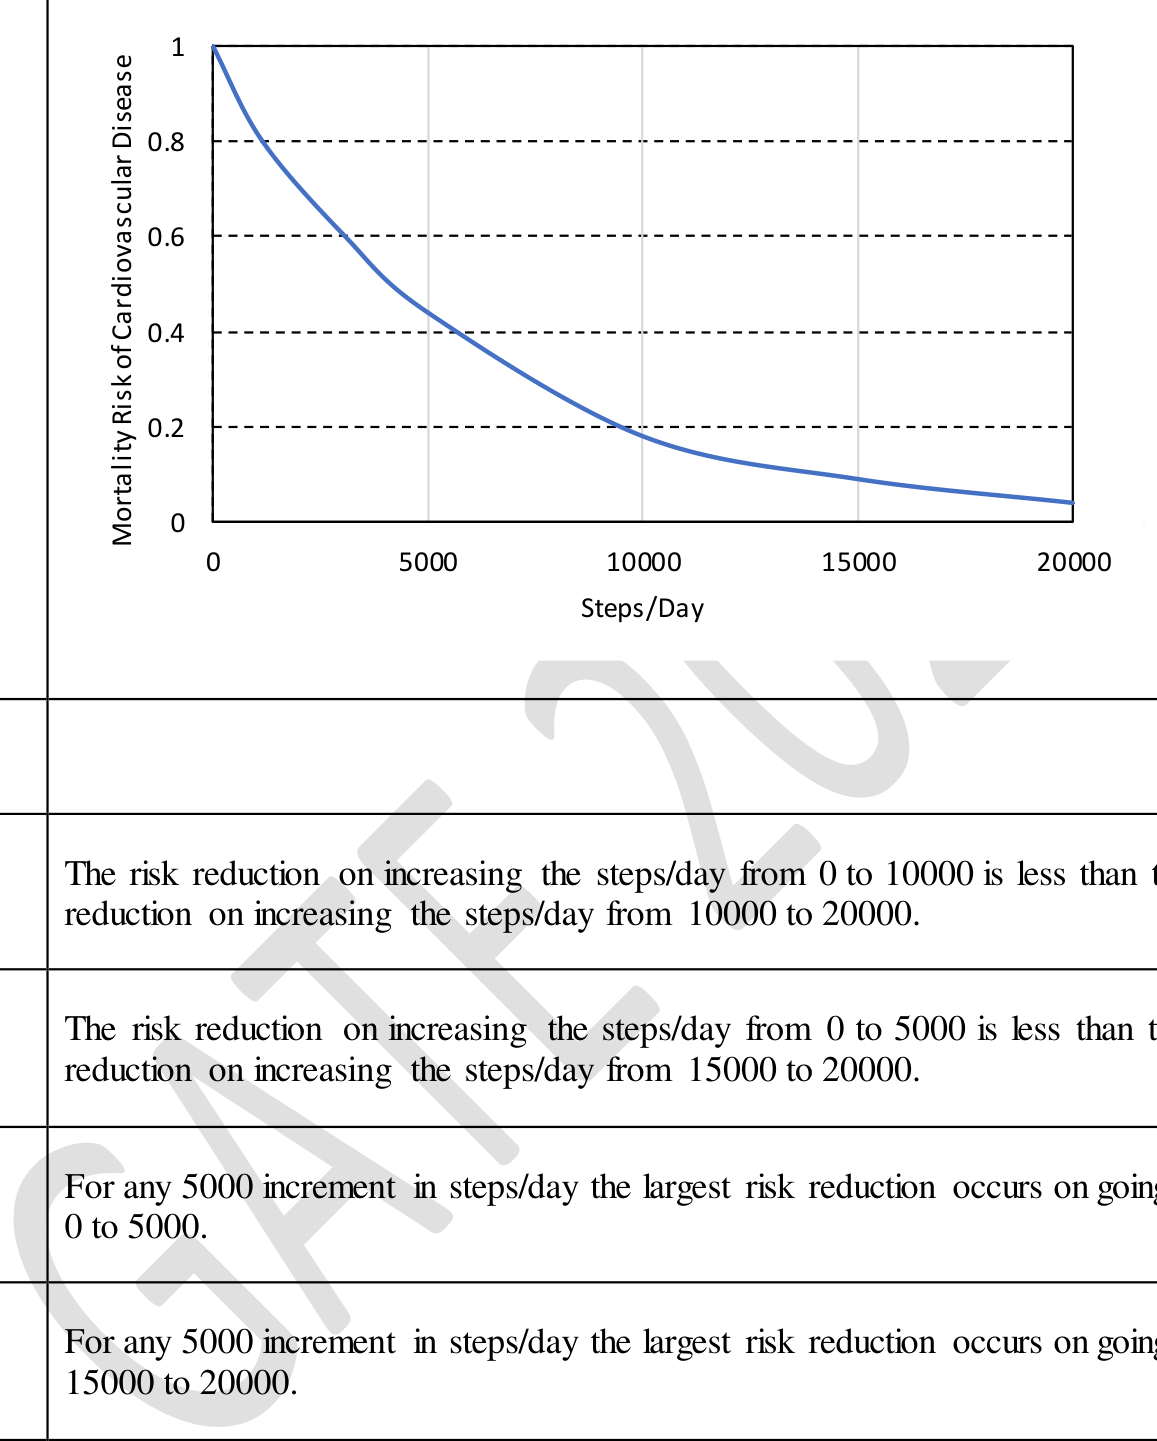
The plot below shows the relationship between the mortality risk of cardiovascular disease and the number of steps a person walks per day. Based on the data, which one of the following options is true?

Source question diagram

Open complete paper
6
2020 · General Aptitude (GA) · Data Interpretation · Elementary Statistics
Instrumentation Engineering (IN) 2020
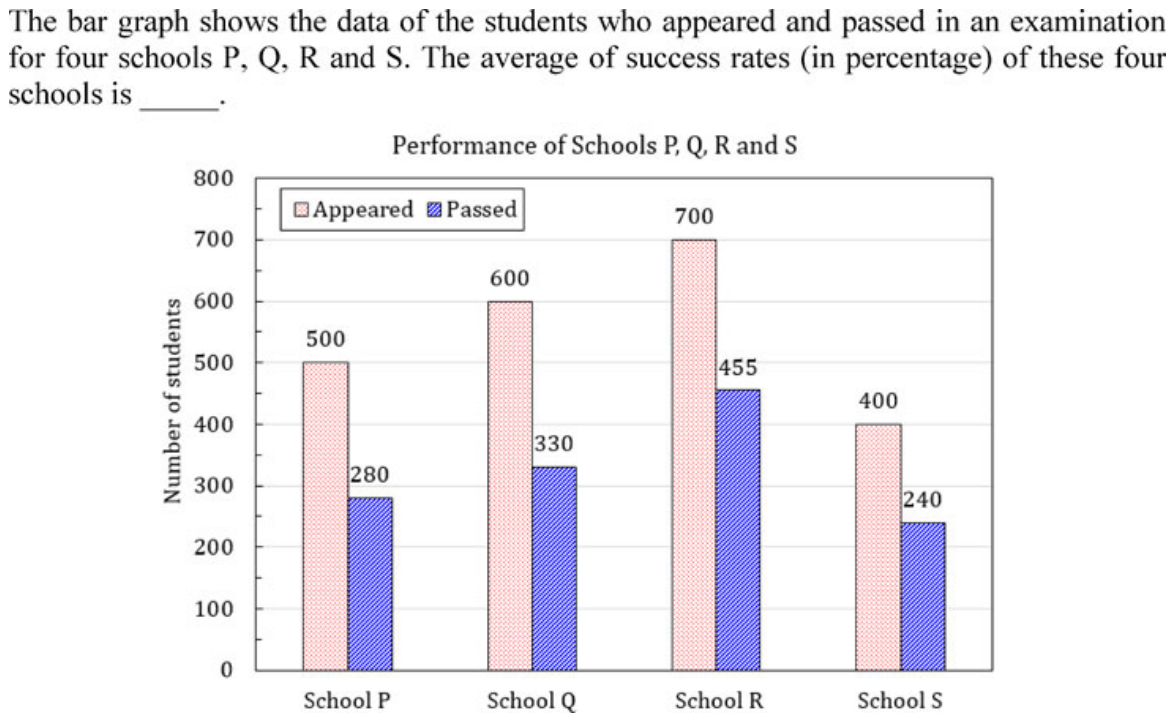
The bar graph shows the data of the students who appeared and passed in an examination for four schools P, Q, R and S. The average of success rates (in percentage) of these four schools is ____.

Question source image

Open complete paper