My Cart
Your Cart 0

    Your cart is empty.

  • Total (Amount) ₹0.00
Previous year question hub

Elementary Statistics - Data Interpretation - General Aptitude (GA) Previous Year Questions

Practice Elementary Statistics - Data Interpretation - General Aptitude (GA) previous year questions organised from real papers, with year-wise coverage and clear topic navigation.

4Papers
4Years
5Questions
1Topics

Elementary Statistics question pattern

Every graph below is calculated only from this selection.

Questions by year

Year-wise coverage for Elementary Statistics. Each bar uses a separate theme-derived color.

Difficulty distribution

How the classified questions are distributed by difficulty.

Medium 4 80%
Easy 1 20%

Question type distribution

MCQ, numerical, multiple-select and other formats found in these papers.

MCQ 5 100%

Subject weightage

Top subjects by unique question coverage.

General Aptitude (GA)
5 Qs

Most asked topics

Top topics across the included previous year papers.

Data Interpretation
5 Qs

Subtopic coverage

Top subtopics inside this exact selection.

Elementary Statistics
5 Qs

Paper coverage

Question coverage for the most populated papers. Every active PYP paper remains listed below.

Humanities & Social Sciences-Economics (XH-C1) 2025
1 Qs
Humanities & Social Sciences-Economics (XH-C1) 2024
2 Qs
Humanities & Social Sciences-Economics (XH-C1) 2023
1 Qs
Humanities & Social Sciences-Economics (XH-C1) 2021
1 Qs

Included previous year papers

Newest papers appear first. Sort by year, question coverage or name.

PaperYear / sessionQuestions in this viewOpen
Humanities & Social Sciences-Economics (XH-C1) 202520251View paper
Humanities & Social Sciences-Economics (XH-C1) 202420242View paper
Humanities & Social Sciences-Economics (XH-C1) 202320231View paper
Humanities & Social Sciences-Economics (XH-C1) 202120211View paper

All Elementary Statistics previous year questions

Practice every matching question in batches of 20, with every available option.

1
2021 · General Aptitude (GA) · Data Interpretation · Elementary Statistics
Humanities & Social Sciences-Economics (XH-C1) 2021
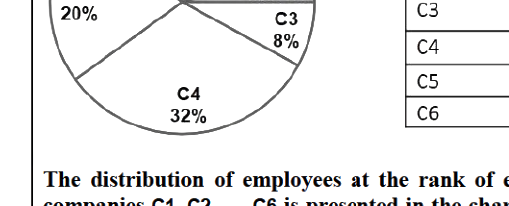
The distribution of employees at the rank of executives, across different companies C1, C2, ..., C6 is presented in the chart given above. The ratio of executives with a management degree to those without a management degree in each of these companies is provided in the table above. The total number of executives across all companies is 10,000.
The total number of management degree holders among the executives in companies C2 and C5 together is_____.

Question diagram

Open complete paper
2
2023 · General Aptitude (GA) · Data Interpretation · Elementary Statistics
Humanities & Social Sciences-Economics (XH-C1) 2023
A recent survey shows that 65% of tobacco users were advised to stop consuming tobacco. The survey also shows that 3 out of 10 tobacco users attempted to stop using tobacco.
Based only on the information in the above passage, which one of the following options can be logically inferred with certainty?
Open complete paper
3
2024 · General Aptitude (GA) · Data Interpretation · Elementary Statistics
Humanities & Social Sciences-Economics (XH-C1) 2024
Three distinct sets of indistinguishable twins are to be seated at a circular table that has 8 identical chairs. Unique seating arrangements are defined by the relative positions of the people.
How many unique seating arrangements are possible such that each person is sitting next to their twin?
Open complete paper
4
2024 · General Aptitude (GA) · Data Interpretation · Elementary Statistics
Humanities & Social Sciences-Economics (XH-C1) 2024
The chart given below compares the Installed Capacity (MW) of four power generation technologies, T1, T2, T3, and T4, and their Electricity Generation (MWh) in a time of 1000 hours (h).

The Capacity Factor of a power generation technology is:
\[ \text{Capacity Factor} = \frac{\text{Electricity Generation (MWh)}}{\text{Installed Capacity (MW)} \times 1000 \text{ (h)}} \]
Which one of the given technologies has the highest Capacity Factor?
Open complete paper
5
2025 · General Aptitude (GA) · Data Interpretation · Elementary Statistics
Humanities & Social Sciences-Economics (XH-C1) 2025
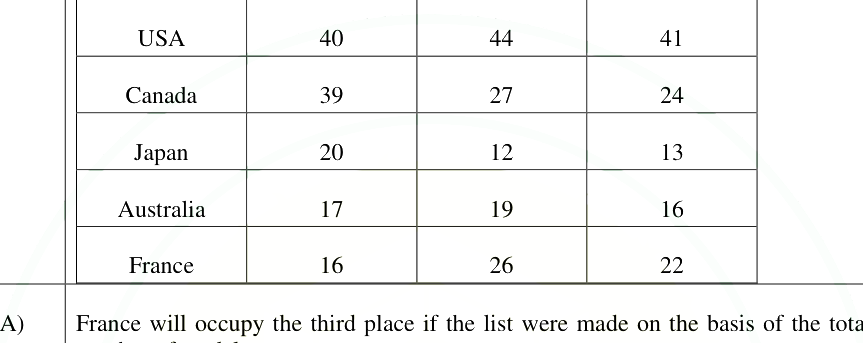
The table lists the top 5 nations according to the number of gold medals won in a tournament; also included are the number of silver and the bronze medals won by them. Based only on the data provided in the table, which one of the following statements is INCORRECT?

Question diagram

Open complete paper