My Cart
Your Cart 0

    Your cart is empty.

  • Total (Amount) ₹0.00
Previous year question hub

Elementary Statistics - Data Interpretation - General Aptitude (GA) Previous Year Questions

Practice Elementary Statistics - Data Interpretation - General Aptitude (GA) previous year questions organised from real papers, with year-wise coverage and clear topic navigation.

8Papers
6Years
12Questions
1Topics

Elementary Statistics question pattern

Every graph below is calculated only from this selection.

Questions by year

Year-wise coverage for Elementary Statistics. Each bar uses a separate theme-derived color.

Difficulty distribution

How the classified questions are distributed by difficulty.

Easy 7 58.3%
Medium 5 41.7%

Question type distribution

MCQ, numerical, multiple-select and other formats found in these papers.

MCQ 10 83.3%
Numerical Answer Type (NAT) 2 16.7%

Subject weightage

Top subjects by unique question coverage.

General Aptitude (GA)
12 Qs

Most asked topics

Top topics across the included previous year papers.

Data Interpretation
12 Qs

Subtopic coverage

Top subtopics inside this exact selection.

Elementary Statistics
12 Qs

Paper coverage

Question coverage for the most populated papers. Every active PYP paper remains listed below.

Geology & Geophysics (GG) 2024 [Session 2]
2 Qs
Geology & Geophysics (GG) 2024 [Session 1]
1 Qs
Geology & Geophysics (GG) 2023 [Session 1]
1 Qs
Geology & Geophysics (GG) 2023 [Session 2]
1 Qs
Geology & Geophysics (GG) 2021
1 Qs
Geology & Geophysics (GG) 2016
1 Qs
Geology & Geophysics (GG) 2015
4 Qs
Geology & Geophysics (GG) 2014
1 Qs

Included previous year papers

Newest papers appear first. Sort by year, question coverage or name.

PaperYear / sessionQuestions in this viewOpen
Geology & Geophysics (GG) 2024 [Session 1]20241View paper
Geology & Geophysics (GG) 2024 [Session 2]20242View paper
Geology & Geophysics (GG) 2023 [Session 1]20231View paper
Geology & Geophysics (GG) 2023 [Session 2]20231View paper
Geology & Geophysics (GG) 202120211View paper
Geology & Geophysics (GG) 201620161View paper
Geology & Geophysics (GG) 201520154View paper
Geology & Geophysics (GG) 201420141View paper

All Elementary Statistics previous year questions

Practice every matching question in batches of 20, with every available option.

1
2014 · General Aptitude (GA) · Data Interpretation · Elementary Statistics
Geology & Geophysics (GG) 2014
The total exports and revenues from the exports of a country are given in the two pie charts below. The pie chart for exports shows the quantity of each item as a percentage of the total quantity of exports. The pie chart for the revenues shows the percentage of the total revenue generated through export of each item. The total quantity of exports of all the items is 5 lakh tonnes and the total revenues are 250 crore rupees. What is the ratio of the revenue generated through export of Item 1 per kilogram to the revenue generated through export of Item 4 per kilogram?
Open complete paper
2
2015 · General Aptitude (GA) · Data Interpretation · Elementary Statistics
Geology & Geophysics (GG) 2015
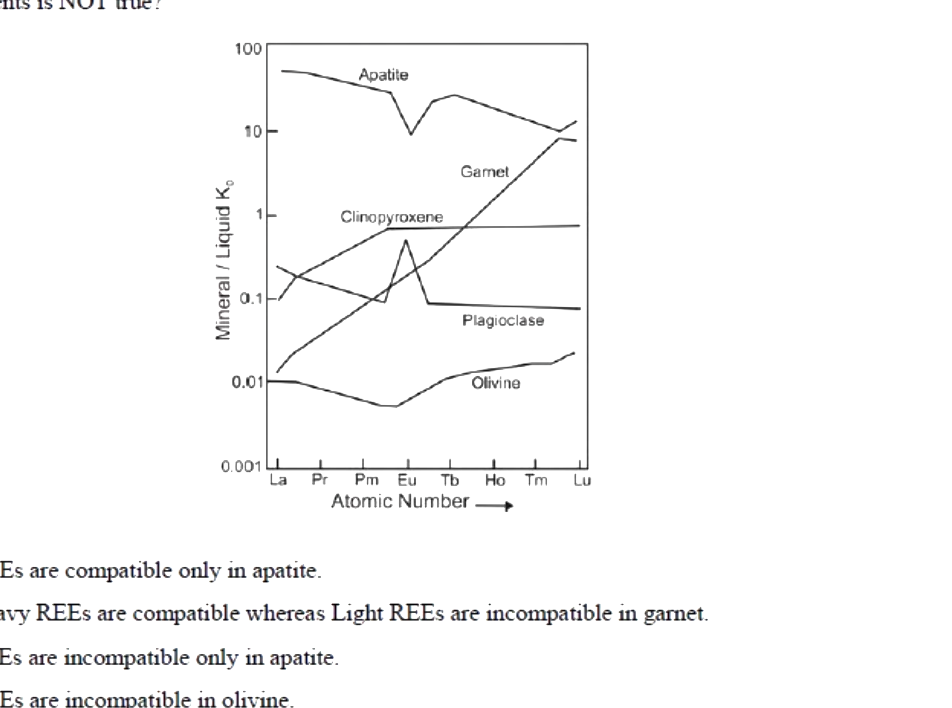
Based on the figure below that shows typical distribution / partition coefficients (KD= mineral/liquid) for REEs between various minerals and basaltic melt, which one of the following statements is NOT true?

Question diagram

Open complete paper
3
2015 · General Aptitude (GA) · Data Interpretation · Elementary Statistics
Geology & Geophysics (GG) 2015
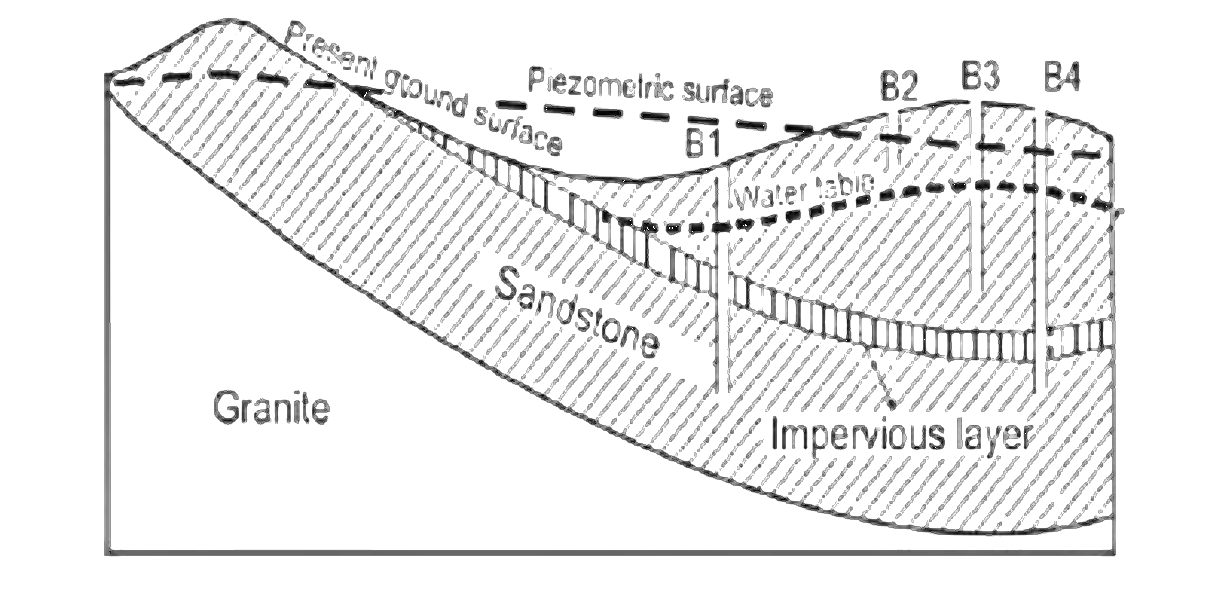
Based on the schematic figure below, match the boreholes B1, B2, B3 and B4 listed in Group I with their features listed in Group II.
Open complete paper
4
2015 · General Aptitude (GA) · Data Interpretation · Elementary Statistics
Geology & Geophysics (GG) 2015
The masses and radioactive heat generation values respectively for different parts of the Earth are tabulated as given below.
RegionMass x 1021 kgRadioactive heat generation x 108 (mWkg-1)
Upper continental crust896.40
Lower continental crust840.00
Oceanic crust718.60
Mantle40800.26
Core18800

Deduce which one of the following statements is NOT correct from the given data

Question diagram

Open complete paper
5
2015 · General Aptitude (GA) · Data Interpretation · Elementary Statistics
Geology & Geophysics (GG) 2015
In a consolidated sandstone formation, the interval transit times of the formation, matrix and fluid are 70 \(\mu\)s, 55 \(\mu\)s and 190 \(\mu\)s respectively. The porosity of the formation is ________.
Open complete paper
6
2016 · General Aptitude (GA) · Data Interpretation · Elementary Statistics
Geology & Geophysics (GG) 2016

Students taking an exam are divided into two groups, P and Q such that each group has the same number of students. The performance of each of the students in a test was evaluated out of 200 marks. It was observed that the mean of group P was 105, while that of group Q was 85. The standard deviation of group P was 25, while that of group Q was 5. Assuming that the marks were distributed on a normal distribution, which of the following statements will have the highest probability of being TRUE?

Open complete paper
7
2024 · General Aptitude (GA) · Data Interpretation · Elementary Statistics
Geology & Geophysics (GG) 2024 [Session 1]
The chart given below compares the Installed Capacity (MW) of four power generation technologies, T1, T2, T3, and T4, and their Electricity Generation (MWh) in a time of 1000 hours (h).
The Capacity Factor of a power generation technology is:
\[ \text{Capacity Factor} = \frac{\text{Electricity Generation (MWh)}}{\text{Installed Capacity (MW)} \times 1000 \text{ (h)}} \]
Which one of the given technologies has the highest Capacity Factor?
Open complete paper
8
2024 · General Aptitude (GA) · Data Interpretation · Elementary Statistics
Geology & Geophysics (GG) 2024 [Session 2]
Three distinct sets of indistinguishable twins are to be seated at a circular table that has 8 identical chairs. Unique seating arrangements are defined by the relative positions of the people.
How many unique seating arrangements are possible such that each person is sitting next to their twin?
Open complete paper
9
2021 · General Aptitude (GA) · Data Interpretation · Elementary Statistics
Geology & Geophysics (GG) 2021
The number of students passing or failing in an exam for a particular subject are presented in the bar chart above. Students who pass the exam cannot appear for the exam again. Students who fail the exam in the first attempt must appear for the exam in the following year. Students always pass the exam in their second attempt.
The number of students who took the exam for the first time in the year 2 and the year 3 respectively, are ______
Open complete paper
10
2023 · General Aptitude (GA) · Data Interpretation · Elementary Statistics
Geology & Geophysics (GG) 2023 [Session 1]
Which one among the following statements must be TRUE about the mean and the median of the scores of all candidates appearing for GATE 2023?
Open complete paper