Difficulty distribution
How the classified questions are distributed by difficulty.
Your cart is empty.
Practice Probability Rules and Distributions - Probability and Statistics - Engineering Sciences previous year questions organised from real papers, with year-wise coverage and clear topic navigation.
Every graph below is calculated only from this selection.
Year-wise coverage for Probability Rules and Distributions. Each bar uses a separate theme-derived color.
How the classified questions are distributed by difficulty.
MCQ, numerical, multiple-select and other formats found in these papers.
Top subjects by unique question coverage.
Top topics across the included previous year papers.
Top subtopics inside this exact selection.
Question coverage for the most populated papers. Every active PYP paper remains listed below.
Newest papers appear first. Sort by year, question coverage or name.
| Paper | Year / session | Questions in this view | Open |
|---|---|---|---|
| Engineering Sciences (XE) 2026 | 2026 | 4 | View paper |
| Engineering Sciences (XE) 2025 | 2025 | 2 | View paper |
| Engineering Sciences (XE) 2024 | 2024 | 4 | View paper |
| Engineering Sciences (XE) 2023 | 2023 | 5 | View paper |
| Engineering Sciences (XE) 2022 | 2022 | 4 | View paper |
| Engineering Sciences (XE) 2021 | 2021 | 3 | View paper |
| Engineering Sciences (XE) 2020 | 2020 | 4 | View paper |
| Engineering Sciences (XE) 2019 | 2019 | 2 | View paper |
| Engineering Sciences (XE) 2018 | 2018 | 3 | View paper |
| Engineering Sciences (XE) 2017 | 2017 | 5 | View paper |
| Engineering Sciences (XE) 2016 | 2016 | 6 | View paper |
| Engineering Sciences (XE) 2015 | 2015 | 2 | View paper |
| Engineering Sciences (XE) 2014 | 2014 | 4 | View paper |
| Engineering Sciences (XE) 2013 | 2013 | 4 | View paper |
| Engineering Sciences (XE) 2012 | 2012 | 4 | View paper |
| Engineering Sciences (XE) 2011 | 2011 | 2 | View paper |
| Engineering Sciences (XE) 2010 | 2010 | 4 | View paper |
| Engineering Sciences (XE) 2009 | 2009 | 1 | View paper |
| Engineering Sciences (XE) 2007 | 2007 | 2 | View paper |
Practice every matching question in batches of 20, with every available option.
25 persons are in a room. 15 of them play hockey, 17 of them play football and 10 of them play both hockey and football. Then the number of persons playing neither hockey nor football is:
The variance of the number of heads resulting from ten independent tosses of a fair coin is
There are two candidates P and Q in an election. During the campaign, 40% of the voters promised to vote for P, and rest for Q. However, on the day of election 15% of the voters went back on their promise to vote for P and instead voted for Q. 25% of the voters went back on their promise to vote for Q and instead voted for P. Suppose, P lost by 2 votes, then what was the total number of voters?

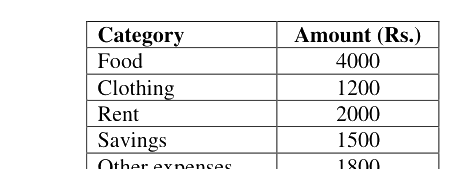
The data given in the following table summarizes the monthly budget of an average household.
| Category | Amount (Rs.) |
|---|---|
| Food | 4000 |
| Clothing | 1200 |
| Rent | 2000 |
| Savings | 1500 |
| Other expenses | 1800 |

There are eight bags of rice looking alike, seven of which have equal weight and one is slightly heavier. The weighing balance is of unlimited capacity. Using this balance, the minimum number of weighings required to identify the heavier bag is
Suppose 50% of the population of a village like oranges, 70% of the population like apples, and 40% like both. If a person is picked at random who likes at least one of these fruits, what is the probability that the person likes oranges?
In a factory, two machines M1 and M2 manufacture 60% and 40% of the autocomponents respectively. Out of the total production, 2% of M1 and 3% of M2 are found to be defective. If a randomly drawn autocomponent from the combined lot is found defective, what is the probability that it was manufactured by M2?
Following table gives data on tourists from different countries visiting India in the year 2011.
| Country | Number of Tourists |
|---|---|
| USA | 2000 |
| England | 3500 |
| Germany | 1200 |
| Italy | 1100 |
| Japan | 2400 |
| Australia | 2300 |
| France | 1000 |
If the mean and variance of a binomial distribution are 6 and 2 respectively, then the probability of two failures is
One percent of the people of country X are taller than 6 ft. Two percent of the people of country Y are taller than 6 ft. There are thrice as many people in country X as in country Y. Taking both countries together, what is the percentage of people taller than 6 ft?

Showing 20 of 65 questions