My Cart
Your Cart 0

    Your cart is empty.

  • Total (Amount) ₹0.00
Previous year question hub

Data Interpretation - General Aptitude - General Aptitude (GA) Previous Year Questions

Practice Data Interpretation - General Aptitude - General Aptitude (GA) previous year questions organised from real papers, with year-wise coverage and clear topic navigation.

3Papers
1Years
6Questions
1Topics

Data Interpretation question pattern

Every graph below is calculated only from this selection.

Questions by year

Year-wise coverage for Data Interpretation. Each bar uses a separate theme-derived color.

Difficulty distribution

How the classified questions are distributed by difficulty.

Medium 4 66.7%
Hard 2 33.3%

Question type distribution

MCQ, numerical, multiple-select and other formats found in these papers.

MCQ 4 66.7%
Numerical Answer Type (NAT) 2 33.3%

Subject weightage

Top subjects by unique question coverage.

General Aptitude (GA)
6 Qs

Most asked topics

Top topics across the included previous year papers.

General Aptitude
6 Qs

Subtopic coverage

Top subtopics inside this exact selection.

Data Interpretation
6 Qs

Paper coverage

Question coverage for the most populated papers. Every active PYP paper remains listed below.

Electronics & Communication Engineering (EC) 2015 [Session 1]
3 Qs
Electronics & Communication Engineering (EC) 2015 [Session 3]
2 Qs
Electronics & Communication Engineering (EC) 2015 [Session 2]
1 Qs

Included previous year papers

Newest papers appear first. Sort by year, question coverage or name.

PaperYear / sessionQuestions in this viewOpen
Electronics & Communication Engineering (EC) 2015 [Session 1]20153View paper
Electronics & Communication Engineering (EC) 2015 [Session 2]20151View paper
Electronics & Communication Engineering (EC) 2015 [Session 3]20152View paper

All Data Interpretation previous year questions

Practice every matching question in batches of 20, with every available option.

1
2015 · General Aptitude (GA) · General Aptitude · Data Interpretation
Electronics & Communication Engineering (EC) 2015 [Session 1]
The waveform of a periodic signal \( x(t) \) is shown in the figure.
A signal \( g(t) \) is defined by \( g(t) = x\left( \frac{t-1}{2} \right) \). The average power of \( g(t) \) is________.

Question diagram

Open complete paper
2
2015 · General Aptitude (GA) · General Aptitude · Data Interpretation
Electronics & Communication Engineering (EC) 2015 [Session 1]
Consider the signal \(s(t) = m(t)\cos(2\pi f_c t) + \hat{m}(t)\sin(2\pi f_c t)\) where \(\hat{m}(t)\) denotes the Hilbert transform of \(m(t)\) and the bandwidth of \(m(t)\) is very small compared to \(f_c\). The signal \(s(t)\) is a
Open complete paper
3
2015 · General Aptitude (GA) · General Aptitude · Data Interpretation
Electronics & Communication Engineering (EC) 2015 [Session 1]
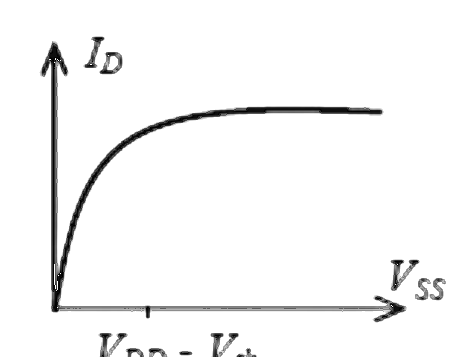
For the NMOSFET in the circuit shown, the threshold voltage is \(V_{th}\), where \(V_{th} > 0\). The source voltage \(V_{SS}\) is varied from 0 to \(V_{DD}\). Neglecting the channel length modulation, the drain current \(I_D\) as a function of \(V_{SS}\) is represented by
Open complete paper
4
2015 · General Aptitude (GA) · General Aptitude · Data Interpretation
Electronics & Communication Engineering (EC) 2015 [Session 2]
Consider a binary, digital communication system which uses pulses \(g(t)\) and \(-g(t)\) for transmitting bits over an AWGN channel. If the receiver uses a matched filter, which one of the following pulses will give the minimum probability of bit error?
Open complete paper
5
2015 · General Aptitude (GA) · General Aptitude · Data Interpretation
Electronics & Communication Engineering (EC) 2015 [Session 3]
In the circuit shown in the figure, the BJT has a current gain (β) of 50. For an emitter-base voltage VEB = 600 mV, the emitter-collector voltage VEC (in Volts) is ______.

Question diagram

Open complete paper
6
2015 · General Aptitude (GA) · General Aptitude · Data Interpretation
Electronics & Communication Engineering (EC) 2015 [Session 3]

The electric field profile in the depletion region of a p-n junction in equilibrium is shown in the figure. Which one of the following statements is NOT TRUE?

Question diagram

Open complete paper